
Image Copyright 2012 by Passy’s World of Mathematics
Rail Networks are quite familiar to most of us. Recently Passy visited Sydney in Australia, and found the rail network system to be far superior to that of Melbourne.
The Melbourne Rail Network is an old fashioned “Hub and Spoke” Network as shown below.
(Click the above image to go Full-size).
This means that to get to many places we have to go into the City and then back out again. It also means that all trains have to go into the city loop and then back out again.
The Sydney Network is a “Looped Network” with several hubs, which makes getting around much easier, since there are many more options for taking train routes to various destinations.
This is shown in the diagram below.
(Click the above image to go Full-size).
Rail Networks are just one kind of Network.
There are also Electricity Distribution Networks, Mobile Phone Networks, Neurological Networks in humans and animals, Road Networks, Distribution Networks, Computer Networks including the Internet, Social Networks, Terrorist Networks, and many others.
In this lesson we look at the basic Mathematics of Networks.
Networks and Social Networking
The following video is an excellent introduction to Networks, including an overview of Social Networks.
Mathematical Components of a Network
“Networks” belong to an area of mathematics called “Topology”.
Networks contain “Vertices” (or dots), “Edges” (or Connector Lines and Curves), and “Regions” (or Areas).
Here is a typical basic Network Diagram.
Note that we have coloured in the Regions; however network diagrams are not usually coloured in like this.
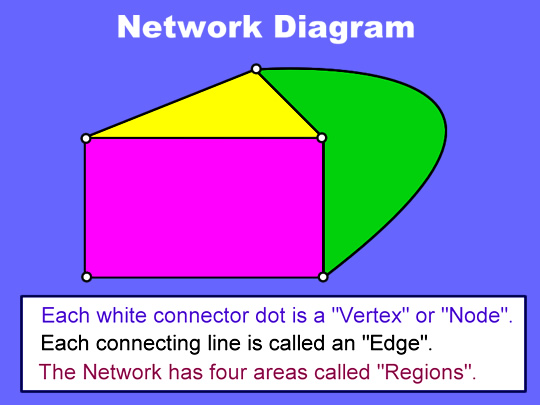
Image Copyright 2012 by Passy’s World of Mathematics
There are four Areas or “Regions” on the above diagram, because the outside Blue area is also counted as a Region.
There are five “Vertices” on the diagram which connect together the lines and curved edges.
The above Network has seven “Edges”. (Note that Edges can be straight lines or curves).
Network Equation
There is an equation which works for every Network, and is useful for checking answers.
The Equation is:
Regions + Vertices = Edges + 2
In our sample Network shown previously, substituting into the above Equation gives:
4 + 5 = 7 + 2
If the equation does not work out equal on both sides for a Network, then one of our counts of the Vertices, Edges, or Regions must be incorrect, and we need to go back and check through our work.
Network Examples
In the following examples, work out how many “Vertices”, “Edges”, and “Regions” there are.
Remember to also count the area outside each Network as a Region.
Also check your answers using the Network Equation: R + V = E + 2
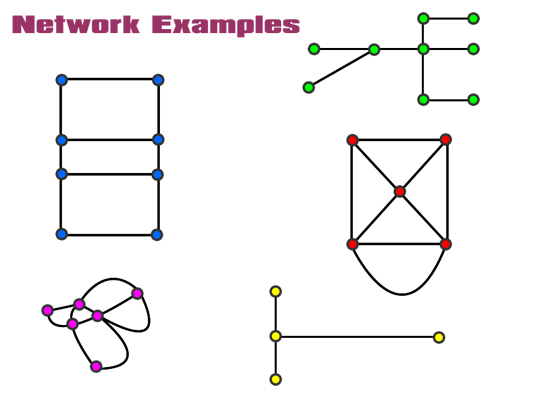
Image Copyright 2012 by Passy’s World of Mathematics
Answers to Examples
The Blue Network has 4 Regions, 8 Vertices, 10 Edges, and R + V = E + 2 gives 4 + 8 = 10 + 2
The Green Network has 1 Region, 9 Vertices, 8 Edges, and R + V = E + 2 gives 1 + 9 = 8 + 2
The Red Network has 6 Regions, 5 Vertices, 9 Edges, and R + V = E + 2 gives 6 + 5 = 9 + 2
The Pink Network has 6 Regions, 6 Vertices, 10 Edges, and R + V = E + 2 gives 6 + 6 = 10 + 2
The Yellow Network has 1 Region, 4 Vertices, 3 Edges, and R + V = E + 2 gives 1 + 4 = 3 + 2
Tree Diagram Network
Image Source: http://www.syque.com
A tree diagram is a special type of open network. This Network has only one Region, but many Vertices and Edges.
In this “Tree” topology, any two vertices are connected by exactly one path.
Each vertex connects to one or more other Vertices, making the Network branch out into more and more paths that can be taken from the original starting point.
Tree Diagrams are useful for organising tasks, and classifying situations into groupings. They are also used for breaking down complex items into sub-groups of simpler items.
Colouring in Networks
Most Maps contain borders of Suburbs, States, or Countries on them which form a Network of Edges.
These will form enclosed regions when we colour them in.
The rule for colouring in such diagrams is that two adjoining Regions next to each other must not be shaded in the same colour.
Not every region has to be a different colour, but we need to make sure we separate regions using colours, and do not have two regions next to each other as the exact same colour.
This is shown in the following example of the map of Australia and its States.
This first example is incorrect, because the two middle states have been coloured in the same red colour. This makes it appear as though they are one region instead of two separate regions.
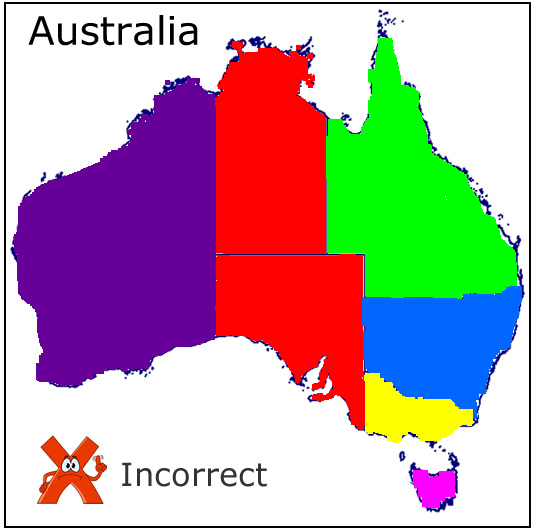
Image Copyright 2012 by Passy’s World of Mathematics
The next example shown below is correct, where all regions can be seen as being separate from each other. It does not matter that we have used the colour pink for two separate regions, because they do not touch each other on the map.
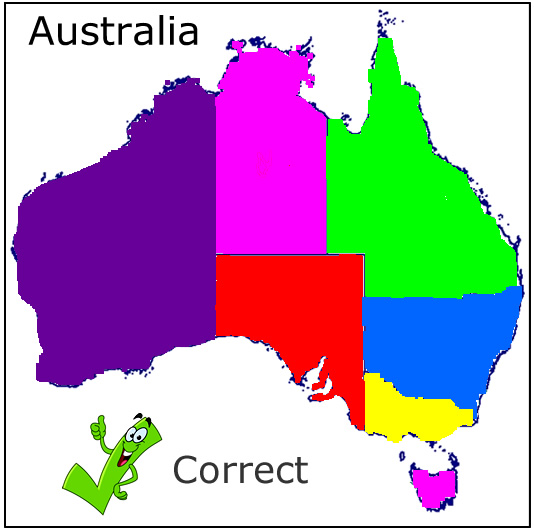
Image Copyright 2012 by Passy’s World of Mathematics
If we were asked to colour the map in using the least number of colours possible, then the following would be one of several possible correct solutions that use only four colours.
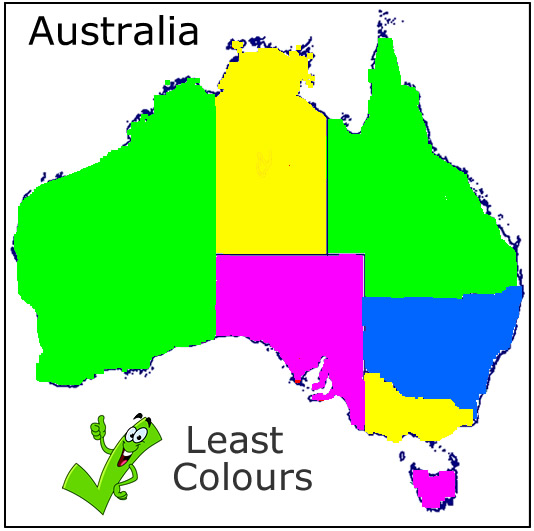
Image Copyright 2012 by Passy’s World of Mathematics
Flow Networks

Image Source: http://cauchoscastilla.com
If we add capacity to a network structure, such as liquids flowing through a network of pipes at an oil refinery, then we have a “Flow Network”.
A flow must satisfy the restriction that the amount of flow into a node (or Vertex) equals the amount of flow out of it, except when it is a source, which has more outgoing flow, or a sink, which has more incoming flow.
A flow network can be used to model traffic in a road system, fluids in pipes, currents in an electrical circuit, or anything similar in which something travels through a network of nodes.
There is a good overview of Flow Networks on Wikipedia, at the following web page:
http://en.wikipedia.org/wiki/Flow_network
Networks and Traffic Flow
In the following video, Dr. Chris Bishop explains an interesting paradox that shows how the removal of very fast roads, (like removing a tunnel through the middle of a city), can actually reduce average journey times.
Additional Information
There is a great introduction to Network Mathematics written by Bruce Hoppe at the following web page:
The following article discusses some of the modern research and developments associated with Networks.
http://news.cnet.com/2009-1069-978596.html
If you enjoyed this post, why not get a free subscription to our website.
You can then receive notifications of new pages directly to your email address.
Go to the subscribe area on the right hand sidebar, fill in your email address and then click the “Subscribe” button.
To find out exactly how free subscription works, click the following link:
If you would like to submit an idea for an article, or be a guest writer on our blog, then please email us at the hotmail address shown in the right hand side bar of this page.
Feel free to link to any of our Lessons, share them on social networking sites, or use them on Learning Management Systems in Schools.
Enjoy,
Passy


Pingback: Traversable and Hub Networks | Passy's World of Mathematics
Pingback: Sydney Harbour Bridge Mathematics | Passy's World of Mathematics