Real World Venn Diagrams

Sorry Picture Not Found
Image Source: http://farm3.static.flickr.com

Venn Diagrams are diagrams containing circles that show the logical relations between a collection of sets or groups.

They are used in many areas of life where we need to categorize or group items, as well as compare and contrast different items.

In this post we will take a look at several real world uses of Venn Diagrams and Set Theory.

eBay and Set Theory

eBay Query for Landcruiser
Image Source: Passy’s World of Mathematics

When we use eBay or any other shopping search engines, set theory is involved.

If systems like eBay stored all of their items in one giant database set, then it would take much longer than a couple of seconds to get a response to our search query.

What these computer systems do is split up their data into several separate sets, such as all of the Products for Australia, all the cars for Australia, all of the Toyota Cars for Australia, and so on.

When we do the search query shown above, the eBay computer searches its database and finds the intersection or “join” of two sets:

Toyota Cars which are Landcruiser models

and

Toyota Cars which have a price Between $20000 and $40000

This enables the search results to be obtained and displayed very quicky.

eBay Query Results
Image Source: Passy’s World of Mathematics

This type of processing involves use of Database Tables and “SQL” Structured Query Language, that uses AND, OR, and NOT statements to do set theory operations on the data.

Understanding Venn Diagrams and Set Theory is crucial for anyone wanting to work as a Computer Programmer or Database Administrator.


Practical Examples of Venn Diagrams

In the remainder of this lesson, there are plenty of real world Venn Diagrams that we found by Googling the web.

As you will see, Venn Diagrams are used in the Sciences, in Languages, in Social Studies, in Economics, and also sometimes just for fun.

If a diagram is too small to see, then click on it to go full size. You may then have to use the browser back button to return to this page.

As our first example, the following Venn Diagram compares the features on different models of PlayStation 3 gaming consoles.

Sorry Picture Not Found
Image Source: http://www.wired.com

The following is a Venn Diagram used by Medical Researchers showing the overlapping genes associated with different brain diseases.

Genes Disease Venn Diagram
Image Source: http://www.pasteur.gr

Venn diagrams are Used in Biology to compare different Animals.

Sorry Picture Not Found
Image Source: http://www.learnnc.org

Another Biological Venn Diagram is this one.

Sorry Picture Not Found
Image Source: http://k-8visual.info

Here is a Venn Diagram that classifies Fish into different biological groupings.

Sorry Picture Not Found
Image Source: http://3.bp.blogspot.com

This next Venn Diagram compares Tigers and Bison.

Sorry Picture Not Found
Image Source: http://wc1.smartdraw.com

Microsoft Excel even has an extension pack which Biologists use.
The following shows a comparison of Humans, Gorillas and Bonobos done in Excel.

Sorry Picture Not Found
Image Source: http://farm5.static.flickr.com

All sorts of things can be analysed with Venn Digarams:

Sorry Picture Not Found
Image Source: http://skew.dailyskew.com


Here is another interesting analysis done using Venn Diagrams.

GraphJam Literacy Diagram
Image Source: http://graphjam.files.wordpress.com

Venn Diagrams are used in Language to make detailed analysis and comparisons.

The following Venn Diagram shows types of English words that are different in spelling and meanings.

Sorry Picture Not Found
Image Source: http://images-mediawiki-sites.thefullwiki.org

Diagrams can also be used when studying literature to compare the content of novels.

Comparing Novels Venn
Image Source: http://1.bp.blogspot.com

Venn Diagrams can also be used to compare characters in a novel.

Sorry Picture Not Found
Image Source: http://users.manchester.edu

They can also be used to critique the works of all the Authors a person has been reading.

Sorry Picture Not Found
Image Source: http://brandon.pulpexplosion.com

Venn Diagrams can be used to show the relationships in complex organizations such as the European Economic Union.
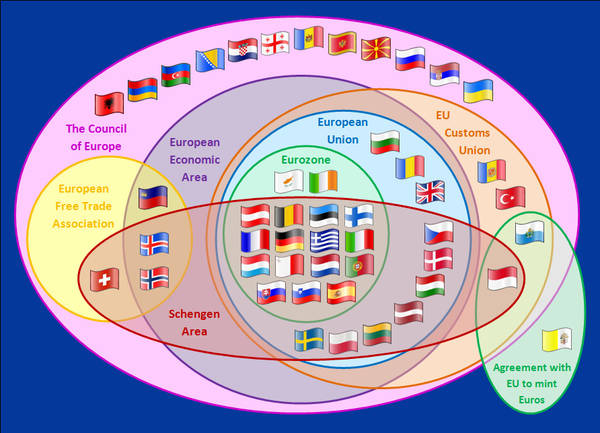
Sorry Picture Not Found
Image Source: http://craphound.com

Diagrams can also be used in Geography to explain how nation groups and states belong to each other. (Click on this image to make it fully visible).
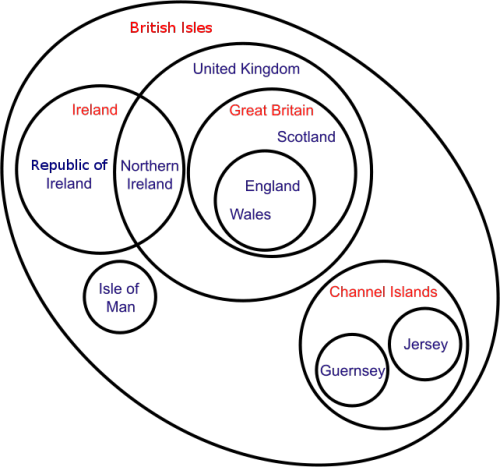
Sorry Picture Not Found
Image Source: http://28.media.tumblr.com

Here is a diagram which shows the relationship between Solids and Liquids.

Compare Solids and Liquids
Image Source: http://3.bp.blogspot.com

Venn diagrams can be used to list all the issues associated with environmental and economic concerns.

Sorry Picture Not Found
Image Source: http://wc1.smartdraw.com

Venn Diagrams are used in Psychology.

Sorry Picture Not Found
Image Source: http://1.bp.blogspot.com

Venn Diagrams can be used to show the changing nature of work in our world.

Sorry Picture Not Found
Image Source: http://www.discover.tased.edu.au

Diagrams can also be used by Human Resource Managers and Careers Advisors to show the characteristics of different jobs.

Sorry Picture Not Found
Image Source: http://4.bp.blogspot.com

Venn Diagrams can be used for analysing the effectiveness of websites.

Sorry Picture Not Found
Image Source: http://www.insidehighered.com

Venn Diagrams are used in Psychology and Wellbeing.
The following diagram represents “The Four Areas Of A Thriving Life”

Sorry Picture Not Found
Image Source: http://thriveology.com

Venn Diagrams are used by Scientists studying human health and medicines.
The following diagram is all about “Amino Acids” which are essential to human life.

Sorry Picture Not Found
Image Source: http://www.dsimb.inserm.fr

Venn Diagrams are used in Politics to describe types of government systems.

Governments Venn Diagram
Image Source: http://ca8thhistorystandards.wikispaces.com

This one shows a Comparison Between Responsibilities of American State and Federal Governments.

US Fed vs State Gov Venn Diagram
Image Source: http://datadeb.files.wordpress.com

Venn Diagrams are used by Geologists and Mining Engineers for mineral exploration.

Sorry Picture Not Found
Image Source: http://www.auzex.com

Venn Diagrams can be used to analyse Religions.
(Click on this image to make it fully visible).

Sorry Picture Not Found
Image Source: http://www.pps.k12.or.us

Venn Diagrams are used a lot in modern Marketing Analysis.

Sorry Picture Not Found
Image Source: http://farm3.static.flickr.com

Venn Diagrams are used in Mathematics to divide all possible number types into groups.

Sorry Picture Not Found
Image Source: http://thinkzone.wlonk.com

They are also used in Mathematics to see what groups of numbers have things in common.

Sorry Picture Not Found
Image Source: http://www.helpingwithmath.com

Venn Diagrams can even be used to analyse music.

Sorry Picture Not Found
Image Source: http://www.dailyfunnystuff.net

We can analyse the characters in TV shows like “The Muppets” with a Venn Diagram.

Sorry Picture Not Found
Image Source: http://2.bp.blogspot.com

Some people even use Venn Diagrams to make jokes about Venn Diagrams.

Sorry Picture Not Found
Image Source: http://2.bp.blogspot.com

And some people just make funny Venn Diagrams for humorous purposes.

Sorry Picture Not Found
Image Source: http://15.media.tumblr.com

The following Venn diagram was made by someone who has obviously used a lot of Public Toilets.

Sorry Picture Not Found
Image Source: http://30.media.tumblr.com

The following diagram summarizes my own experiences of Airline seating perfectly.
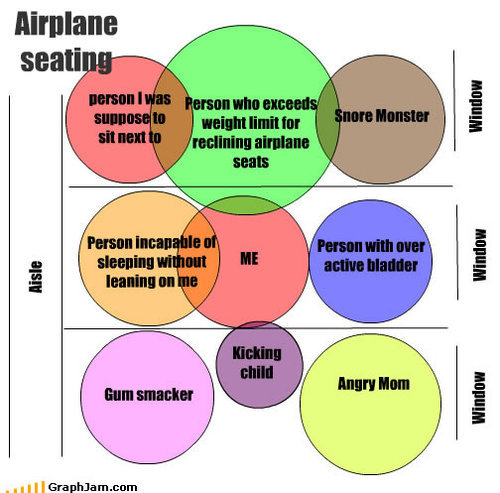
Sorry Picture Not Found
Image Source: http://25.media.tumblr.com

Related Items

Introduction to Venn Diagrams
Venn Diagram Word Problems
Three Circle Venn Diagrams

If you enjoyed this post, why not get a free subscription to our website.
You can then receive notifications of new pages directly to your email address.

Go to the subscribe area on the right hand sidebar, fill in your email address and then click the “Subscribe” button.

To find out exactly how free subscription works, click the following link:

How Free Subscription Works

If you would like to submit an idea for an article, or be a guest writer on our blog, then please email us at the hotmail address shown in the right hand side bar of this page.

Enjoy,
Passy

Share
Posted in Graphs, Venn Diagrams | Tagged , , , , , , , , , , , , , , , , , , , , | 4 Comments

Three Circle Venn Diagrams

istockphoto pets
Image Source: istockphoto Purchased by Passy’s World

Three circle Venn Diagrams are a step up in complexity from two circle diagrams.

In this lesson we first look at how to read three circle diagrams. We then look at some word problems.


Reading Three Circle Diagrams

A Music Survey was carried out to find out what types of music a group of people liked.

The results were placed into the following three circle Venn Diagram.

Venn 3 Word Pic 1
Image Source: Passy’s World of Mathematics

To find out the total number of people surveyed, (or the E = Everything value), we add up all the numbers in the diagram.

When we do this the answer is 70.

This “E = Everything value” is also called “The Universal Set” of everything in the universe of our diagram.

If we want to find the total number of people who like “Rock” music, then we add up all of the numbers in the “Rock” circle, including the areas where “Rock” overlaps with the other circles.

The Total Rock People is: 16 + 2 + 8 + 5 = 31 people.

We can also work out Probability or Odds from our Venn Diagram.

For example we have found that 31 people out of 70 like Rock Music.

So if we pick any one person at random from our group, the chances, or odds, or probability, that they will like Rock music is 31 out of 70, or 31 / 70, or 31/70 x100 = 44%.

We can find the number of people who like all three types of music, by going to the centre of our diagram, where all three circles overlap.

There are 8 people who like all three types of music.


Venn Diagram Word Problem One

This first problem is a fairly easy one, where all of the information we need has been given to us in the question.

“A Class of 40 students completed a survey on what pets they like. The choices were: Cats, Dogs, and Birds. Everyone liked at least one pet.
10 students liked Cats and Birds but not dogs
6 students liked Cats and Dogs but not birds
2 students liked Dogs and Birds but not Cats
2 students liked all three pets
10 students liked Cats only
9 students liked Dogs only
1 student liked Birds only

Represent these results using a three circle Venn Diagram.”

The type of three circle Venn Diagram we will need is the following:

Three Circle Venn Diagram Pic 2
Image Source: Passy’s World of Mathematics

This three circle word problem is an easy one.

All of the number values for each section of the diagram have been given to us in the question.

All we need to do is carefully put the number values onto the Diagram.

We also need to check that all of the numbers add up to the total of 40 students when we are finished.

The completed Venn Diagram is shown below.

Three Circle Venn Diagram Pic 3
Image Source: Passy’s World of Mathematics

Note that we do not need to color in and fill in the circles on Venn Diagrams.

The following diagram is also correct and a fully acceptable answer.

Three Circle Venn Diagram Pic 4
Image Source: Passy’s World of Mathematics


Venn Diagram Word Problem Two

This is a harder version of Problem One, where we are given less
information in the question text. This means that we will need to do
some working out steps to get to the final completed diagram.

Three Circle Venn Diagram Pic 5
Image Source: Passy’s World of Mathematics

We need the exact same type of Venn Diagram as for Question 1.

Three Circle Venn Diagram Pic 2
Image Source: Passy’s World of Mathematics

We now need to go carefully through the word problem, and work out what information we can use straight away.

There should always be some data we can place onto the diagram to get started, even though it might not seem to be that much.

Three Circle Venn Diagram Pic 6
Image Source: Passy’s World of Mathematics

When we place what we know so far onto the diagram, this is what we have:

Three Circle Venn Diagram Pic 7
Image Source: Passy’s World of Mathematics

We now need to work through the other information in the word problem, one piece at a time.

Usually in these problems we need to work on the overlapping parts in the centre of the diagram, and then work our way out to the “Cats Only”, “Dogs Only”, and “Birds Only” outer sections of the diagram.

Remember: Work for the Inside Out.

Here is what we will do next.

Three Circle Venn Diagram Pic 8
Image Source: Passy’s World of Mathematics

This information refers to the following section of the Venn Diagram.

Three Circle Venn Diagram Pic 9
Image Source: Passy’s World of Mathematics

We can now fill in the answer of “2” onto the centre of our diagram.

Three Circle Venn Diagram Pic 10
Image Source: Passy’s World of Mathematics

We now have the Birds circle nearly completed.

The only thing left to do is work out the “Birds Only” section, which we will now do.

Three Circle Venn Diagram Pic 11
Image Source: Passy’s World of Mathematics

We can now fill in the answer of “1” onto our diagram.

Three Circle Venn Diagram Pic 12
Image Source: Passy’s World of Mathematics

We now have the Birds circle completed.

Next we work on the Cats Circle, following the exact same steps as we did on the Birds circle.

First we need to work on the overlaps that involve Cats and other animals in the centre of the diagram.

Three Circle Venn Diagram Pic 13
Image Source: Passy’s World of Mathematics

This information refers to the following section of the Venn Diagram.

Three Circle Venn Diagram Pic 14
Image Source: Passy’s World of Mathematics

We can now fill in the answer of “6” onto our diagram.

Three Circle Venn Diagram Pic 15
Image Source: Passy’s World of Mathematics

We are nearly there !

We now only have “Cats Only” and “Dogs Only” to work out, and we have all the information we need to do this.

Three Circle Venn Diagram Pic 16
Image Source: Passy’s World of Mathematics

We can now place the “Cats Only” answer onto our diagram.

Three Circle Venn Diagram Pic 17
Image Source: Passy’s World of Mathematics

We now only need to work out “Dogs Only”.

Three Circle Venn Diagram Pic 18
Image Source: Passy’s World of Mathematics

Our Diagram for Problem Two is now finally complete.

Three Circle Venn Diagram Pic 19
Image Source: Passy’s World of Mathematics

Note that we do not need to color in and fill in the circles on Venn Diagrams.

The following diagram is also a correct and a fully acceptable answer.

Three Circle Venn Diagram Pic 20
Image Source: Passy’s World of Mathematics

Venn Diagram Word Problems Summary

Three Circle Venn Diagram Pic 21
Image Source: Passy’s World of Mathematics


Three Circle Videos

Here is a great Venn Diagrams video which also explains the “Inclusion / Exclusion” method.


This is an interesting three circles problem where they use a table of values to help with the working out.


Here is a video which shows how to do “Complement Sets” for three circle diagrams.


Related Items

Introduction to Venn Diagrams
Venn Diagram Word Problems
Real World Venn Diagrams

If you enjoyed this post, why not get a free subscription to our website.
You can then receive notifications of new pages directly to your email address.

Go to the subscribe area on the right hand sidebar, fill in your email address and then click the “Subscribe” button.

To find out exactly how free subscription works, click the following link:

How Free Subscription Works

If you would like to submit an idea for an article, or be a guest writer on our blog, then please email us at the hotmail address shown in the right hand side bar of this page.

Free Gift Header

If you are a subscriber to Passy’s World of Mathematics, and would like to receive a free PowerPoint version of this lesson, that is 100% free to you as a Subscriber, then email us at the following address:

Email address image

Please state in your email that you wish to obtain the free subscriber copy of the “Three Circles Venn Diagrams” Powerpoint.


Like Us on Facebook

Our Facebook page has many additional items which are not posted to this website.

These include items of mathematical interest, funny math pictures and cartoons, as well as occassional glimpses into the personal life of “Passy”.

Check it out at the following link:

https://www.facebook.com/PassysWorldOfMathematics

While you are there, LIKE the page so you can receive our FB updates to your Facebook News Feed.


Help Passy’s World Grow

Each day Passy’s World provides hundreds of people with mathematics lessons free of charge.

Help us to maintain this free service and keep it growing.

Donate any amount from $2 upwards through PayPal by clicking the PayPal image below. Thank you!


PayPal does accept Credit Cards, but you will have to supply an email address and password so that PayPal can create a PayPal account for you to process the transaction through. There will be no processing fee charged to you by this action, as PayPal deducts a fee from your donation before it reaches Passy’s World.


Enjoy,
Passy

Share
Posted in Graphs, Venn Diagrams | Tagged , , , , , , , , , , , , , , , | 3 Comments

Venn Diagram Word Problems

Cute Puppy and Cat from Izismile
Image Source: http://img.izismile.com

Venn Diagram Word Problems can be very easy to make mistakes on when you are a beginner.

It is extremely important to:

Read the question carefully and note down all key information.

Know the standard parts of a Venn Diagram

Work in a step by step manner

Check at the end that all the numbers add up coorectly.

Let’s start with an easy example of a two circle diagram problem.


Venn Diagrams – Word Problem One

“A class of 28 students were surveyed and asked if they ever had dogs or cats for pets at home.

8 students said they had only ever had a dog.

6 students said they had only ever had a cat.

10 students said they had a dog and a cat.

4 students said they had never had a dog or a cat.”

Note that the word “only” is extremely important in Venn Diagram word problems.

Because the word “only” is in our problem text, it makes it an easy word problem.

Since this question is about dogs and cats, it will require a two circle Venn Diagram.

Here is the type of diagram we will need.

Venn Word Pic One
Image Source: Passy’s World of Mathematics – Copyright 2012

Our problem is an easy one where we have been given all of the numbers for the items required on the diagram.

We do not need to work out any missing values.

All we need to do is place the numbers from the word problem onto the standard Venn Diagram and we are done.

Venn Word Pic Two
Image Source: Passy’s World of Mathematics – Copyright 2012


Venn Diagrams – Word Problem Two

The answer for this question will actually be the same as the Cats and Dogs question in Example 1.

However this time we are given less information, and so we will have work out the missing information.

Here is Problem 2:

“A class of 28 students were surveyed and asked if they ever had dogs or cats for pets at home.

18 students said they had a dog.

16 students said they had a cat.

4 students said they had never had a dog or a cat.”

Note that the word “only” is extremely important in Venn Diagram word problems.

The above question does not contain the word “only” anywhere in it, and this is an indication that we will have to do some working out.

The question states that: “18 students said they had a dog” without the word “only” in there.

This means that the total of the Dogs circle is 18.

The 18 total students for Dogs includes people that have both a cat and a dog, as well as people who only have a dog.

Some people, who do not read this question carefully, will simply take the above figures and put them straight into a Venn Diagram like this.

Venn Word Pic Three
Image Source: Passy’s World of Mathematics – Copyright 2012

Always check at the end that the numbers add up to the “E” Grand total.

16 + 18 + 4 = 38 which is much bigger than the “E” total of 28.

This is because some students have both a cat and a dog. We have not accounted for this at all.

Other people might think that we do not have enough information, and it is therefore impossible to do this problem. This is simply not true.

Let’s put down on our diagram all of the information we have been given.

Venn Word Pic 4
Image Source: Passy’s World of Mathematics – Copyright 2012

From the given information we have been able to work out that the circles total is 24. (Eg. Everything Total – No Cats and No Dogs = 28 – 4 = 24.

This is vital information we now use to work on the rest of the problem.

Let’s first work out the “Only Cats” value.

Venn Word Pic 5
Image Source: Passy’s World of Mathematics – Copyright 2012

Next we work out the “Only Dogs” number of people.

Venn Word Pic 6
Image Source: Passy’s World of Mathematics – Copyright 2012

Let’s now fill in all of the information we have worked out so far.

Venn Word Pic 7
Image Source: Passy’s World of Mathematics – Copyright 2012

All we have left to work out is the number of Cats and Dogs for the center of the diagram.

We can do this any of three possible ways:

Cats and Dogs = Total Cats – Only Cats

or

Cats and Dogs = Total Dogs – Only Dogs

or

Cats and Dogs = E Total – Only Cats – Only Dogs – (No cats and No Dogs)

Any way that we work it out, the answer is 10.

So here is the final completed Venn Diagram Answer.

Venn Word Pic 8
Image Source: Passy’s World of Mathematics – Copyright 2012

When putting answers into our Mathematics Workbook, we do not have to color in the diagram.

A final answer like the following is quite acceptable.

Venn Word Pic 9
Image Source: Passy’s World of Mathematics – Copyright 2012

We can summarise the steps we used to work out this problem as follows.

Word Problem Two – Summary of Steps

– Work out What Information is given, and what needs to be calculated.

– Circles Total = E everything – (No Cats and No Dogs)

– Cats Only = Circles Total – Total Dogs

– Dogs Only = Circles Total – Total Cats

– Cats and Dogs = Cats Total – Cats Only

– Finally, check that all the numbers in the diagram add up to equal the “E” everything total.


Word Problem Three – Subsets

“Fifty people were surveyed and only 20 people said that they regularly eat Healthy Foods like Fruit and Vegetables.

Of these 20 healthy eaters, 12 said that they ate Vegetables every day.

Draw a Venn Diagram to represent these results.”

This problem is quite different to our other two circle diagrams.

Cats and Dogs are very different to each other, and so we needed two separate circles.

However Healthy Foods and Vegetables are not different to each other because Vegetables are a type of Healthy Food.

We say that vegetables are a “Subset” of Healthy Foods.

This means that we do not separate the circles. We actually need to draw our circles inside each other like this.

Venn Word Pic 10
Image Source: Passy’s World of Mathematics – Copyright 2012

The total adds up to 50, and the 12 people who include vegetables in their healthy foods are shown as being fully inside the Healthy Foods circle.


Word Problem Four – Disjoint Sets

“Draw a Venn Diagram which divides the twelve months of the year into the following two groups:

Months whose name begins with the letter “J” and Months whose name ends in “ber”. You will need a two circle Venn Diagram for your answer.”

The first step is to list the twelve months of the year:

January – named after Janus, the god of doors and gates
February – named after Februalia, when sacrifices were made for sins
March – named after Mars, the god of war
April – from aperire, Latin for “to open” (buds)
May – named after Maia, the goddess of growth of plants
June – named after junius, Latin for the goddess Juno
July – named after Julius Caesar in 44 B.C.
August – named after Augustus Caesar in 8 B.C.
September – from septem, Latin for “seven”
October – from octo, Latin for “eight”
November – from novem, Latin for “nine”
December – from decem, Latin for “ten”

Months starting with J = { January, June, July }

Months ending in “ber” = { September, October, November, December }

The two sets do not have any items in common, and so we will not overlap them.

The remaining months will need to go outside of our two circles.

There should be all twelve months in the diagram when we are finished.

The completed Venn Diagram is shown below:

Venn Word Pic 11
Image Source: Passy’s World of Mathematics – Copyright 2012


Venn Word Problems – Summary

We have not included three circle diagrams, as they will be covered in a separate lesson.

Remember that the setup for a two circle Venn Diagram is usually like this:

Venn Word Pic 12
Image Source: Passy’s World of Mathematics – Copyright 2012

Remember the working out steps for harder problems are:

Work out What Information is given, and what needs to be calculated.

Check to see if the two sets are “Subsets” or “Disjoint” sets.

If they are “Intersecting Sets” then some of the following formulas may be needed.

Circles Total = E everything – (Not in A and Not in B)

In A Only = Both Circles Total – Total in B

In A Only = The A Circle Total – Total in the intersection (A and B)

In B Only = Both Circles Total – Total in A

In B Only = The B Circle Total – Total in the intersection (A and B)

In the Intersection (A and B) = Total in B – In B Only

In the Intersection (A and B) = Total in A – In A Only

Finally, check that the numbers in the diagram all add up to equal the “E” everything total.


Venn Word Problems Videos

The following video shows a typical two circles word problem.


Here is a video that covers a two circles problem, where we need to find the number of items that are ( not in “A” and not in “B”)


Here is a Video which shows how to solve Venn Diagram Survey Problems.


The following video is another very good one from “YourMathGal” about how to draw Venn Diagrams for word problems.


Related Items

Introduction to Venn Diagrams
Three Circle Venn Diagrams
Real World Venn Diagrams

If you enjoyed this post, why not get a free subscription to our website.
You can then receive notifications of new pages directly to your email address.

Go to the subscribe area on the right hand sidebar, fill in your email address and then click the “Subscribe” button.

To find out exactly how free subscription works, click the following link:

How Free Subscription Works

If you would like to submit an idea for an article, or be a guest writer on our blog, then please email us at the hotmail address shown in the right hand side bar of this page.

Free Gift Header

If you are a subscriber to Passy’s World of Mathematics, and would like to receive a free PowerPoint version of this lesson, that is 100% free to you as a Subscriber, then email us at the following address:

Email address image

Please state in your email that you wish to obtain the free subscriber copy of the “Venn Diagrams Word Problems” Powerpoint.


Like Us on Facebook

Our Facebook page has many additional items which are not posted to this website.

These include items of mathematical interest, funny math pictures and cartoons, as well as occassional glimpses into the personal life of “Passy”.

Check it out at the following link:

https://www.facebook.com/PassysWorldOfMathematics

While you are there, LIKE the page so you can receive our FB updates to your Facebook News Feed.


Help Passy’s World Grow

Each day Passy’s World provides hundreds of people with mathematics lessons free of charge.

Help us to maintain this free service and keep it growing.

Donate any amount from $2 upwards through PayPal by clicking the PayPal image below. Thank you!


PayPal does accept Credit Cards, but you will have to supply an email address and password so that PayPal can create a PayPal account for you to process the transaction through. There will be no processing fee charged to you by this action, as PayPal deducts a fee from your donation before it reaches Passy’s World.


Enjoy,
Passy

Share
Posted in Venn Diagrams | Tagged , , , , , , , , , , , , , | 3 Comments

Venn Diagrams Introduction

Venn 1 Moths

The above picture is called a “Venn Diagram”, or “Venn-Euler Diagram”.

It shows the similarities and differences between Moths and Butterflies.

The characteristics of moths have been placed in the green circle, and butterflies in the blue circle.

Because the two insects have some common features, the two circles have been made to overlap each other.

The common features are put into this common area, where the two circles cross each other and overlap.

This overlapping region is called the “Intersection” of the Venn Diagram.

The diagram is put inside a big rectangle which is called the “Universal Set”.

The “Universal Set” rectangle contains inside it everything that we have listed about Moths and Butterflies.


Definition of a Set

A “Set” is a collection of items that belong to a well defined category or group.

For example, a fish belongs to the group of animals which live in water.

Sets are enclosed in pairs of curly brackets { }

For example, we could write the following for the set of our favorite animals which live in water:

Water Animals = { Fish, Eel, Platypus }

Elements” are the items in sets.

Eg. “Fish” is an element of { Water Animals } .

We can have another set of our favorite animals written like this:

Two Legged Animals = { Birds, Bats }

When we draw the Venn Diagram for these two sets, there is nothing in common between the two groups.

Venn Pic 2

We call these two sets “Mutually Exclusive”. This means any item must belong to only one of the sets, and the two sets have nothing in common.


Complementary Sets

The “complement” of a set is everything not in that set. (Symbol A’)

For our previous two circles inside the rectangle universal set, we have the two sets:

Water Animals = { Fish, Eel, Platypus }

Two Legged Animals = { Birds, Bats }

The complement of Water Animals is all of the animals in our Venn Diagram that are not inside the Water Animals circle.

Therefore the complement of the Water Animals is the set:

Water Animals’ = { Bird, Bat }

Venn Complementary Pic 3


Two Circle Venn Diagram

Let’s change our previous example so that it now contains the following Universal set of Animals:

E = Everything = { Fish, Eels, Platypus, Penguins, Eagles, Bats }

We are going to use a Venn diagram to divide these animals into the following two sets:

“Water Animals” and “Two Legged Animals” .

When we do this, we find that Penguins belong in both groups:

E = Everything = { Fish, Eels, Platypus, Penguins, Eagles, Bats }

Water Animals = { Fish, Eels, Platypus, Penguins }

Two Legged Animals = { Eagles, Bats, Penguins }

This means that on our Venn Diagram, we will need to have two overlapping circles, so that we can put Penguins inside both circles.

Venn Pic 4 Intersection


Union of Sets

The union of two sets is everything that is contained within the two circles joined together.

It is the combined total of the two sets, where each item is only listed once.

For our Venn Diagram of Two Legged Animals and Water Animals, we have:

{ Two Legged Animals } Union { Water Animals } =

{ Fish, Eels, Platypus, Penguins, Eagles, Bats }

Union is often written using a big “U” symbol, or the word “OR”.

Venn Pic 5 Union


Difference Between “OR” and “AND”

The word “OR” is used for Union.

“OR” actually means that everything in our Union answer set is either in one circle, OR in the other circle.

The word “AND” in sets is used for “Intersection” and means that the item is contained in both sets.

Venn Pic 6


Venn Diagrams with Counts

Often Venn Diagrams do not list all the individual item names in the diagram.

Instead they list a count of how many items there are in each particular group.

This is shown in the diagram below, where we have converted our Animals Diagram into a Counts Diagram.

Venn Pic 7 Counts


Venn Diagrams Summary

The main concepts covered in this introduction have been Union, Intersection, Mutually Exclusive, and Complements as applied to two circle Venn Diagrams.

Venn Pic 8


Venn 9 Intersection
Image Source: Passy’s World of Mathematics


Venn Pic 10


Venn Pic 11 Union
Image Source: Passy’s World of Mathematics


Venn Pic 12


Venn 13 Complement A
Image Source: Passy’s World of Mathematics


Venn 14 Complement of B
Image Source: Passy’s World of Mathematics


Venn 15 Mutually Ex


Venn 15 Mutually Exc
Image Source: Passy’s World of Mathematics


Venn Subsets Text


Venn Subsets Diagram
Image Source: Passy’s World of Mathematics


Venn Empty Set


Venn Power Sets


Venn Cardinal Number


Videos About Venn Diagrams

The following is a good example of how Intersection and Union work in Venn Diagrams.


Here is a short video about Intersection


Here is a musical video showing Intersection. It is a bit out there but gets the point across.


Here is a Video all about Union of sets.


Here is a Video all about Set Notation.


Here is a video which shows some more advanced aspects of Intersection of sets.


Related Items

Venn Diagram Word Problems
Three Circle Venn Diagrams
Real World Venn Diagrams

If you enjoyed this post, why not get a free subscription to our website.
You can then receive notifications of new pages directly to your email address.

Go to the subscribe area on the right hand sidebar, fill in your email address and then click the “Subscribe” button.

To find out exactly how free subscription works, click the following link:

How Free Subscription Works

If you would like to submit an idea for an article, or be a guest writer on our blog, then please email us at the hotmail address shown in the right hand side bar of this page.

Free Gift Header

If you are a subscriber to Passy’s World of Mathematics, and would like to receive a free PowerPoint version of this lesson, that is 100% free to you as a Subscriber, then email us at the following address:

Email address image

Please state in your email that you wish to obtain the free subscriber copy of the “Introduction to Venn Diagrams” Powerpoint.

Enjoy,
Passy

Share
Posted in Venn Diagrams | Tagged , , , , , , , , , | 4 Comments

Welcome to the New Home

Virtual Interior New Room
Image Source: http://www.homedecoratingideaspictures.com

Welcome to the new permanent home of Passy’s World of Mathematics.

We hope you find our new features on this site useful and easy to use.


What’s in our New Home

Everything that was on the old site, as well as ongoing new lessons

Integration of Passy’s World with our PowerPoints on Slideshare

Slideshare presentations which are all Apple device compatible

Printable Mathematics Posters

Easier Free Subscription

Fully updated cross references in “Related Items” sections of all lessons

Simplified and shortened URL addresses for all our lessons

eBooks becoming available later this year.


How to Use Our New Site

Use the top of page Black Navigation Menu bar to access each feature.

Use the “INDEX” button on this top menu bar to find all our lessons easily.


Moving to a self hosted WordPress infrastructure gives Passy’s World many new opportunities to better serve all teachers and students of mathematics.

Enjoy,
Passy

Share
Posted in Uncategorized | Leave a comment