

Image Source: http://farm3.static.flickr.com
Venn Diagrams are diagrams containing circles that show the logical relations between a collection of sets or groups.
They are used in many areas of life where we need to categorize or group items, as well as compare and contrast different items.
In this post we will take a look at several real world uses of Venn Diagrams and Set Theory.
eBay and Set Theory
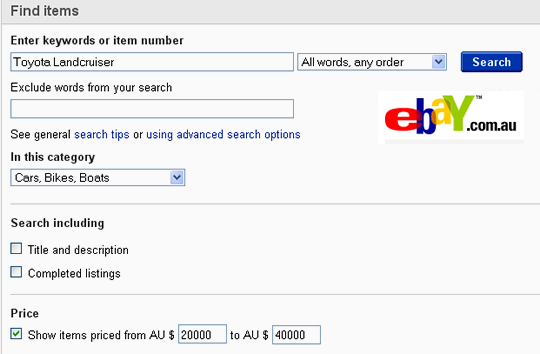
Image Source: Passy’s World of Mathematics
When we use eBay or any other shopping search engines, set theory is involved.
If systems like eBay stored all of their items in one giant database set, then it would take much longer than a couple of seconds to get a response to our search query.
What these computer systems do is split up their data into several separate sets, such as all of the Products for Australia, all the cars for Australia, all of the Toyota Cars for Australia, and so on.
When we do the search query shown above, the eBay computer searches its database and finds the intersection or “join” of two sets:
Toyota Cars which are Landcruiser models
and
Toyota Cars which have a price Between $20000 and $40000
This enables the search results to be obtained and displayed very quicky.
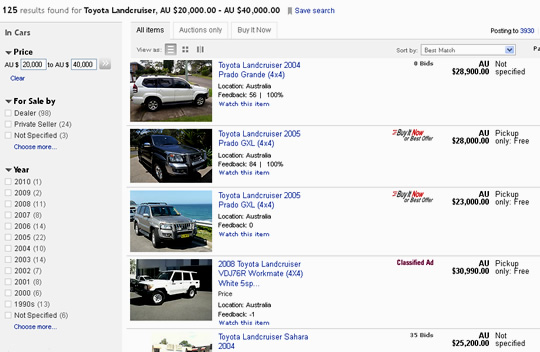
Image Source: Passy’s World of Mathematics
This type of processing involves use of Database Tables and “SQL” Structured Query Language, that uses AND, OR, and NOT statements to do set theory operations on the data.
Understanding Venn Diagrams and Set Theory is crucial for anyone wanting to work as a Computer Programmer or Database Administrator.
Practical Examples of Venn Diagrams
In the remainder of this lesson, there are plenty of real world Venn Diagrams that we found by Googling the web.
As you will see, Venn Diagrams are used in the Sciences, in Languages, in Social Studies, in Economics, and also sometimes just for fun.
If a diagram is too small to see, then click on it to go full size. You may then have to use the browser back button to return to this page.
As our first example, the following Venn Diagram compares the features on different models of PlayStation 3 gaming consoles.

Image Source: http://www.wired.com
The following is a Venn Diagram used by Medical Researchers showing the overlapping genes associated with different brain diseases.

Image Source: http://www.pasteur.gr
Venn diagrams are Used in Biology to compare different Animals.

Image Source: http://www.learnnc.org
Another Biological Venn Diagram is this one.

Image Source: http://k-8visual.info
Here is a Venn Diagram that classifies Fish into different biological groupings.
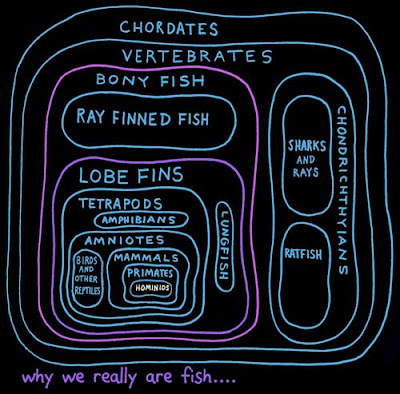
Image Source: http://3.bp.blogspot.com
This next Venn Diagram compares Tigers and Bison.

Image Source: http://wc1.smartdraw.com
Microsoft Excel even has an extension pack which Biologists use.
The following shows a comparison of Humans, Gorillas and Bonobos done in Excel.

Image Source: http://farm5.static.flickr.com
All sorts of things can be analysed with Venn Digarams:

Image Source: http://skew.dailyskew.com
Here is another interesting analysis done using Venn Diagrams.

Image Source: http://graphjam.files.wordpress.com
Venn Diagrams are used in Language to make detailed analysis and comparisons.
The following Venn Diagram shows types of English words that are different in spelling and meanings.

Image Source: http://images-mediawiki-sites.thefullwiki.org
Diagrams can also be used when studying literature to compare the content of novels.

Image Source: http://1.bp.blogspot.com
Venn Diagrams can also be used to compare characters in a novel.
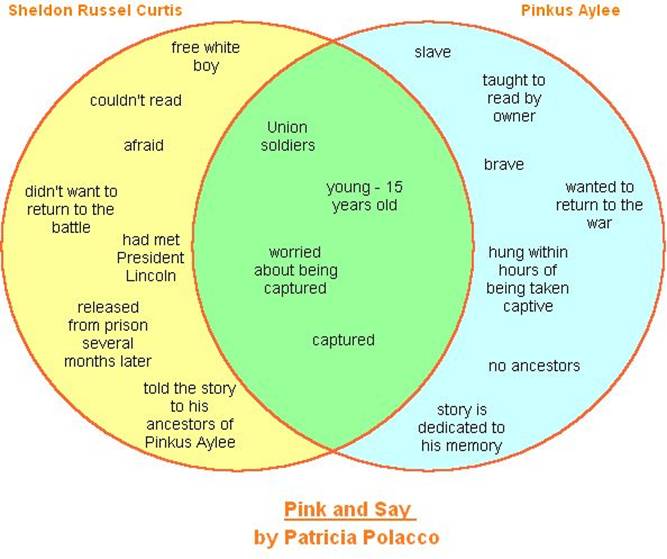
Image Source: http://users.manchester.edu
They can also be used to critique the works of all the Authors a person has been reading.

Image Source: http://brandon.pulpexplosion.com
Venn Diagrams can be used to show the relationships in complex organizations such as the European Economic Union.
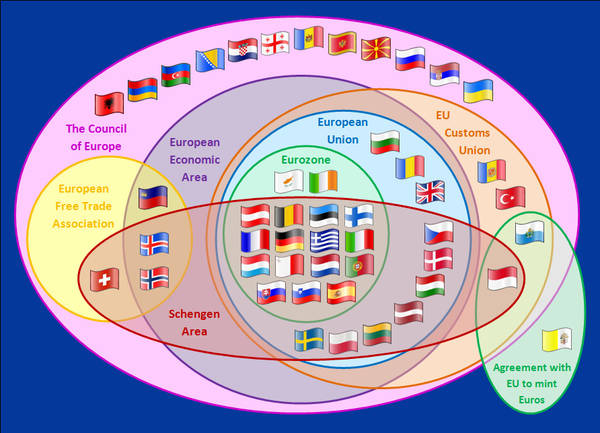
Image Source: http://craphound.com
Diagrams can also be used in Geography to explain how nation groups and states belong to each other. (Click on this image to make it fully visible).
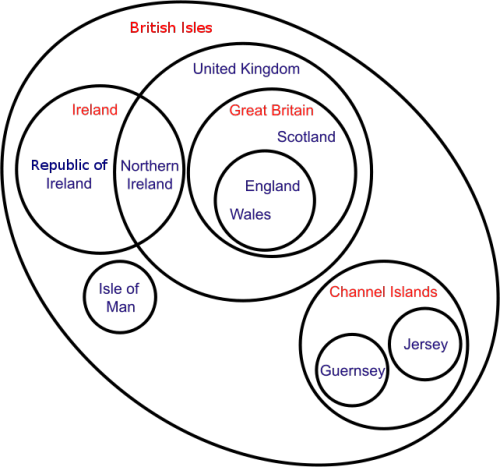
Image Source: http://28.media.tumblr.com
Here is a diagram which shows the relationship between Solids and Liquids.

Image Source: http://3.bp.blogspot.com
Venn diagrams can be used to list all the issues associated with environmental and economic concerns.

Image Source: http://wc1.smartdraw.com
Venn Diagrams are used in Psychology.

Image Source: http://1.bp.blogspot.com
Venn Diagrams can be used to show the changing nature of work in our world.

Image Source: http://www.discover.tased.edu.au
Diagrams can also be used by Human Resource Managers and Careers Advisors to show the characteristics of different jobs.

Image Source: http://4.bp.blogspot.com
Venn Diagrams can be used for analysing the effectiveness of websites.

Image Source: http://www.insidehighered.com
Venn Diagrams are used in Psychology and Wellbeing.
The following diagram represents “The Four Areas Of A Thriving Life”

Image Source: http://thriveology.com
Venn Diagrams are used by Scientists studying human health and medicines.
The following diagram is all about “Amino Acids” which are essential to human life.

Image Source: http://www.dsimb.inserm.fr
Venn Diagrams are used in Politics to describe types of government systems.

Image Source: http://ca8thhistorystandards.wikispaces.com
This one shows a Comparison Between Responsibilities of American State and Federal Governments.

Image Source: http://datadeb.files.wordpress.com
Venn Diagrams are used by Geologists and Mining Engineers for mineral exploration.

Image Source: http://www.auzex.com
Venn Diagrams can be used to analyse Religions.
(Click on this image to make it fully visible).
Image Source: http://www.pps.k12.or.us
Venn Diagrams are used a lot in modern Marketing Analysis.
Image Source: http://farm3.static.flickr.com
Venn Diagrams are used in Mathematics to divide all possible number types into groups.

Image Source: http://thinkzone.wlonk.com
They are also used in Mathematics to see what groups of numbers have things in common.
Image Source: http://www.helpingwithmath.com
Venn Diagrams can even be used to analyse music.

Image Source: http://www.dailyfunnystuff.net
We can analyse the characters in TV shows like “The Muppets” with a Venn Diagram.

Image Source: http://2.bp.blogspot.com
Some people even use Venn Diagrams to make jokes about Venn Diagrams.

Image Source: http://2.bp.blogspot.com
And some people just make funny Venn Diagrams for humorous purposes.

Image Source: http://15.media.tumblr.com
The following Venn diagram was made by someone who has obviously used a lot of Public Toilets.
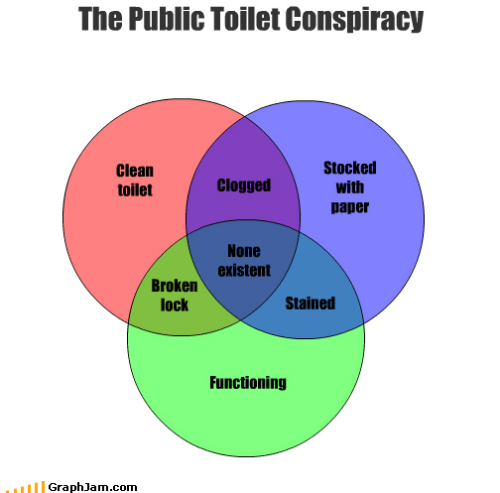
Image Source: http://30.media.tumblr.com
The following diagram summarizes my own experiences of Airline seating perfectly.
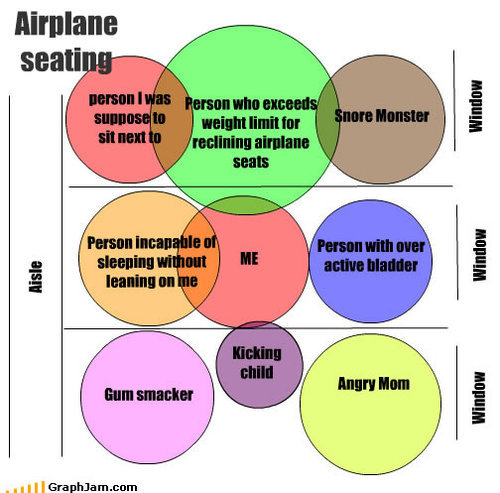
Image Source: http://25.media.tumblr.com
Related Items
Introduction to Venn Diagrams
Venn Diagram Word Problems
Three Circle Venn Diagrams
If you enjoyed this post, why not get a free subscription to our website.
You can then receive notifications of new pages directly to your email address.
Go to the subscribe area on the right hand sidebar, fill in your email address and then click the “Subscribe” button.
To find out exactly how free subscription works, click the following link:
If you would like to submit an idea for an article, or be a guest writer on our blog, then please email us at the hotmail address shown in the right hand side bar of this page.
Enjoy,
Passy


Pingback: Venn Diagram Word Problems | Passy's World of Mathematics
Pingback: Three Circle Venn Diagrams | Passy's World of Mathematics
Pingback: Coffee Spill Mathematics | Passy's World of Mathematics
Pingback: Mathematics of the Melbourne Cup | Passy's World of Mathematics