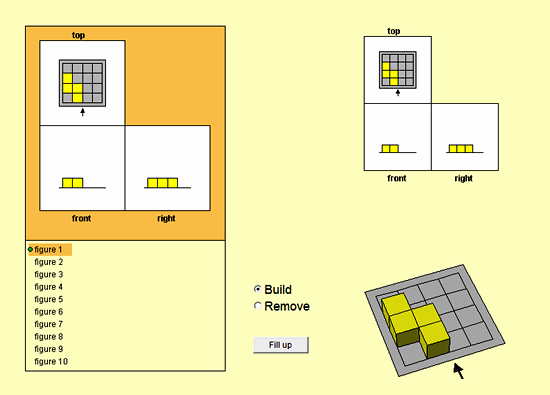
On the main entry page, go to “Building with 3 Sides” and then choose the figures to do (there are 10 puzzles). You can move the grey grid square around to help you do views.
Once you play around and get used to how build mode works, it is a lot of fun.
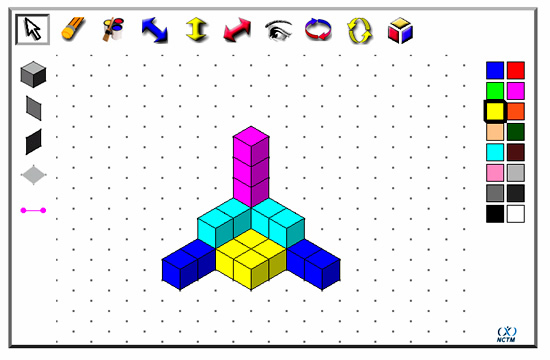
Important tip for beginners – Build the top view onto the base mat first, and then work upwards from there.
While you are there, LIKE the page so you can receive our FB updates to your Facebook News Feed.
Help Passy’s World Grow
Each day Passy’s World provides hundreds of people with mathematics lessons free of charge.
Help us to maintain this free service and keep it growing.
Donate any amount from $2 upwards through PayPal by clicking the PayPal image below. Thank you!
PayPal does accept Credit Cards, but you will have to supply an email address and password so that PayPal can create a PayPal account for you to process the transaction through. There will be no processing fee charged to you by this action, as PayPal deducts a fee from your donation before it reaches Passy’s World.
If you enjoyed this lesson, why not get a free subscription to our website. You can then receive notifications of new lessons directly to your email address.
Go to the subscribe area on the right hand sidebar, fill in your email address and then click the “Subscribe” button.
To find out exactly how free subscription works, click the following link:
If you would like to submit an idea for an article, or be a guest writer on our Website, then please email us at the hotmail address shown in the right hand side bar of this page.
Feel free to link to any of our Lessons, share them on social networking sites, or use them on Learning Management Systems in Schools.
Image Copyright 2012 by Passy’s World of Mathematics
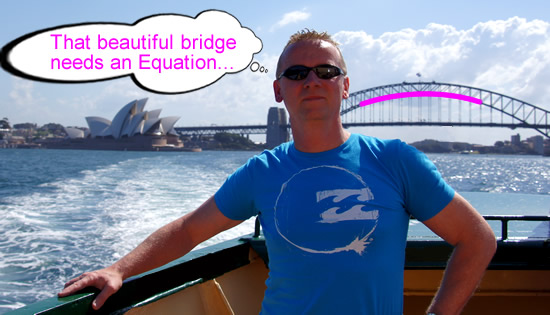
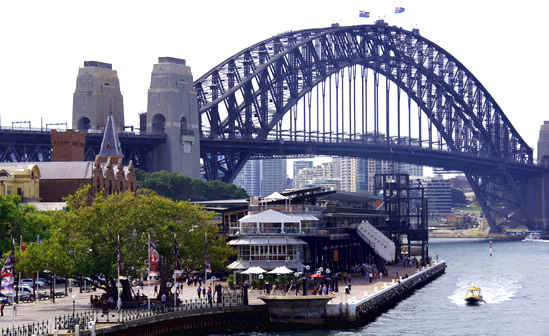
The Sydney Harbour bridge is a magnificent structure of mathematical genius, located in what has to be the world’s most beautiful city.
In this lesson we look at the mathematics associated with the Sydney Bridge, including deriving the Quadratic Equations for both the lower and upper parabolic arches of the bridge. We then look at some additional mathematics of the bridge, as well as some similar bridges in other countries.
There is an accompanying worksheet of our labelled measurement photographs, for teachers to set their own mathematics classes the task of calculating these equations. (See the “Free Gift to Subscribers” section at the end of this lesson for details).
Lower Arch Parabola
Image Copyright 2012 by Passy’s World of Mathematics
(Click the above image to enlarge to full size)
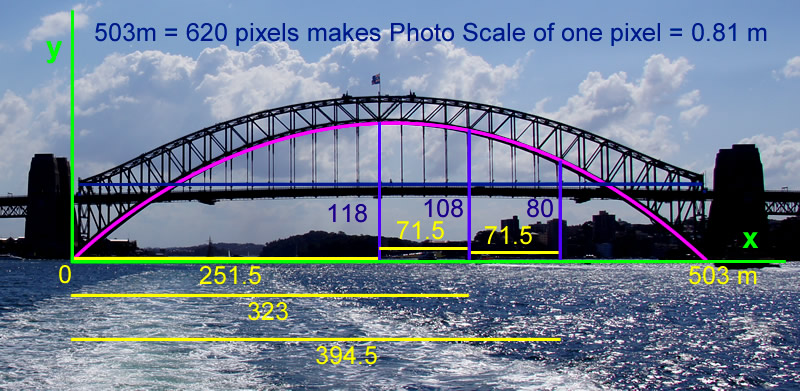
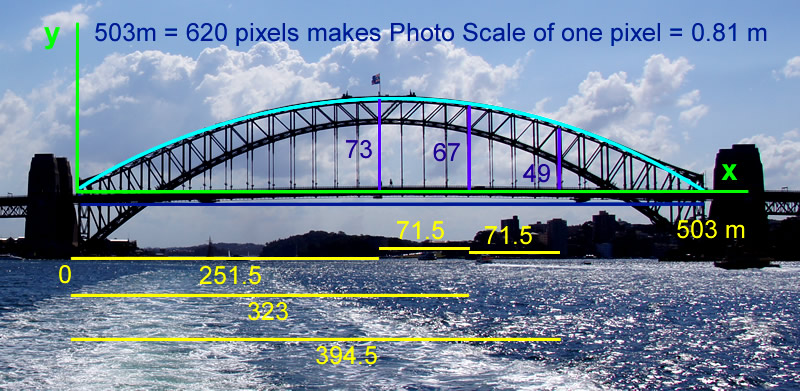
Our approach to this problem was to use a photo we had taken of the bridge, and by making measurements on the photo in pixel units, (using Adobe Fireworks), scale the photo and obtain some (x,y) values to work with.
The “Scale Factor” was derived by knowing that the real life span distance of the roadway below the arch was 503 meters, and then comparing this with the number of pixels (or dots) on the photo for this span.
As shown above, this enabled us to then establish the following key values:
Vertex Turning point is located at (h,k) = (251.5, 118)
Three other (x,y) points on the arch are: (323,108) and (394.5,80) and (503,0).
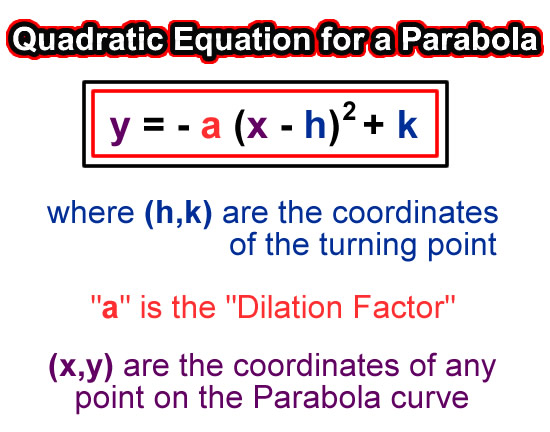
For any inverted Parabola graph, there is a standard equation that uses the (h,k) vertex, and the “Dilation Factor” of “a”, to determine the value of any (x,y) point on the Parabola graph.
The “Dilation Factor” value relates to how much the standard y = x squared parabola shape has been stretched or compressed.
This standard quadratic equation is as follows:
Image Copyright 2012 by Passy’s World of Mathematics
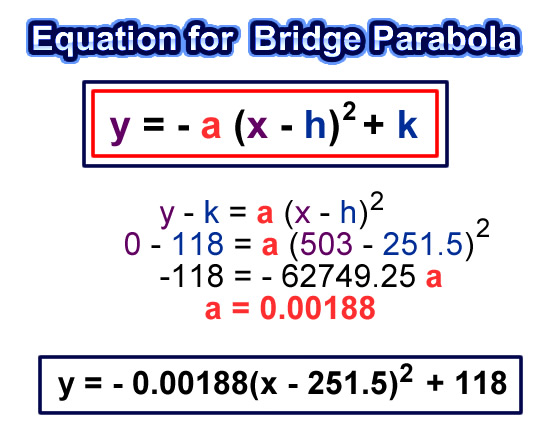
For the Bridge, we have the vertex value, and we have some (x,y) values, and so all we need to do is determine the “a” Dilation Factor value.
This can be done as shown below:
Image Copyright 2012 by Passy’s World of Mathematics
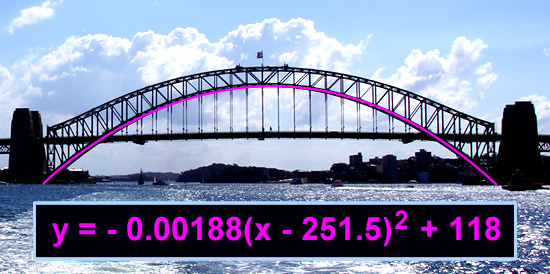
Substituting back into the standard equation, we then have the equation for the lower arch of the Bridge as the following:
Image Copyright 2012 by Passy’s World of Mathematics
Note that we have rounded off the Dilation Factor (“a” value) in our Equation to be 0.00188. This means in subsequent checking activities which follow, we did have to round off or truncate some “Y” values.
For better accuracy, the exact value of a = 0.001880501 can be used.
We checked the above equation, by substituting the (x,y) values (323,108) and (394.5,80) and found that the equation is true in both cases.
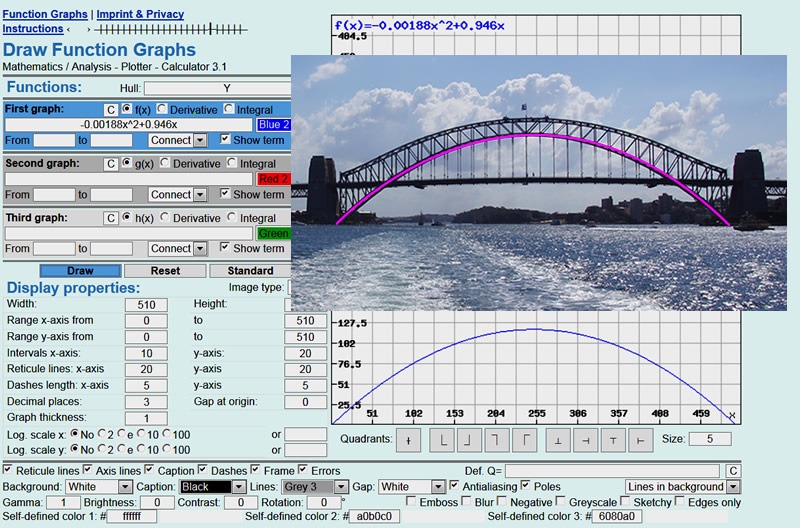
As a final visual check, we graphed our equation using the free online software at “Rechner Online”, and found that the graph shape does match that of the bridge.
Image Copyright 2012 by Passy’s World of Mathematics
(Click the above image to enlarge to full size)
Note that we did have to transform the equation into the graphing form equation shown on the screen capture above, by fully expanding the turning point form, which cancelled out the 118.
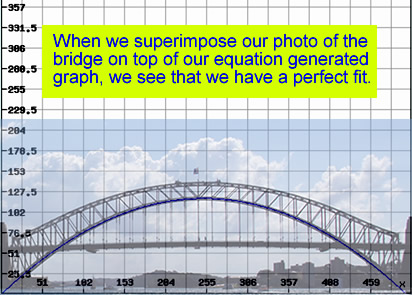
We then superimposed our bridge photo over this graph, which confirmed we have a perfect fit:
Image Copyright 2012 by Passy’s World of Mathematics
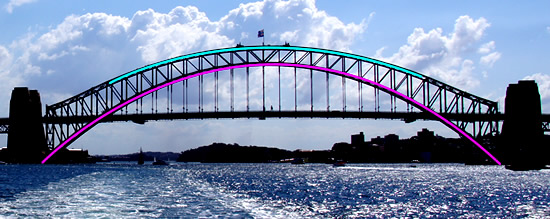
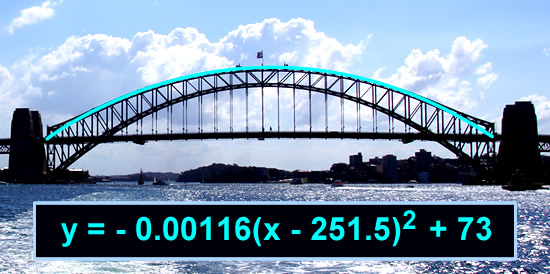
Upper Arch Parabola
Image Copyright 2012 by Passy’s World of Mathematics
The Upper Arch of the Sydney Harbour bridge is a flatter parabola than the lower arch. The Upper Arch is a Parabola in the main section, but then curves in a reverse parabolic shape towards its two end sections.
Shown below are our pixel to meter converted measurements for the upper arch.
Image Copyright 2012 by Passy’s World of Mathematics
(Click the above image to enlarge to full size)
Using the same mathematical methods as we applied to the lower arch, we have determined the equation of the upper arch as follows.
Image Copyright 2012 by Passy’s World of Mathematics
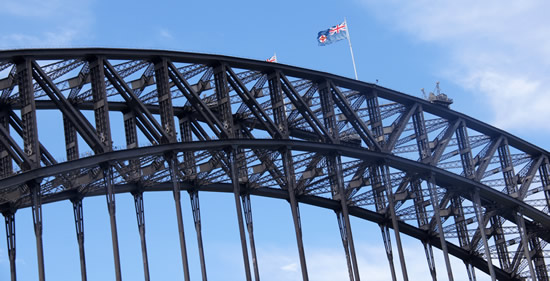
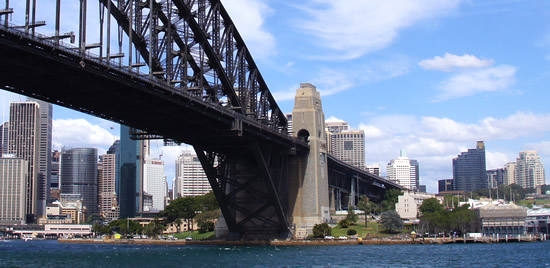
Strength of the Harbour Bridge
The parabolic shape and hanging roadway gives uniform distribution of the massive weight of the bridge.
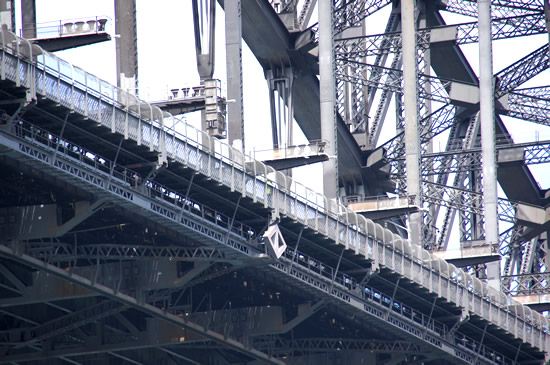
The bridge also has extensive triangulation to give it rigidity and strength.
Image Copyright 2012 by Passy’s World of Mathematics
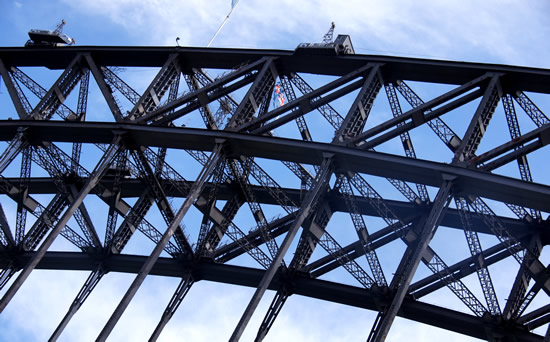
In the cross members of the Bridge, there is also triangulation within the side beams of the main triangles. This creates maximum strength while minimizing weight.
Image Copyright 2012 by Passy’s World of Mathematics
Even under the bridge, and all the way along the sides, there is continual triangulation of the structure.
Image Copyright 2012 by Passy’s World of Mathematics
Bridge Facts and Figures
Image Copyright 2012 by Passy’s World of Mathematics
The following websites have some great photos of the bridge being built in the 1930’s, as well as plenty of mathematical facts and figures.
For example, the surface area that requires painting is equal to about the surface area of 60 sports fields.
During the building of the bridge, 272,000 litres of paint were required to give the Bridge its initial three coats. This would be enough paint to paint around 50,000 bedrooms!
On hot and cold days the two main arches may rise or fall 18 centimetres due to heating or cooling. There are hinges built on the bases of the bridge to cope with this.
A brilliant Engineer called Dr Bradfield designed and project managed the build of the Sydney Harbour Bridge. Not only did he champion its concept and funding, he saw the “Hell Gate” Railway Bridge in New York in the 1920’s (completed in 1916 and almost identical in design to the Sydney Harbour Bridge though smaller) and quickly changed the specification to create a similar design for Sydney.
Had he not done so, the previously accepted design would have been built, which was quite ugly, and a very ordinary suspension bridge in comparison to the marvel we have today.
The following is a great historical video of the building of the bridge.
During the bridge construction, each half arch was held back by a series of cables anchored in tunnels carved in the rock.
There were 128 cables on the southern shore supporting the southern arch and 128 on the northern shore.
Read more about these cables and do some mathematics on the forces they contended with at the following link:
Image Copyright 2012 by Passy’s World of Mathematics
“One of the most critical tasks carried out before construction began was the survey that determined exactly where each of the main bearings was to be located. This was carried out using surveying equipment and a process of triangulation from a set baseline. The survey, using a theodolite, was based on set survey marks at Mrs Macquarie’s point (G), in the grounds of Government House (A, B, E and F), on Kirribilli Head (H) and in Lavender Bay (J).
The triangulation process allowed the centreline of the proposed Bridge (C, D) to be located precisely, and from there the position of the main bearings was set.
In fact two different surveys were carried out, one by Dorman, Long & Co. Ltd. surveyors and the other by NSW Public Works Department surveyors. Each survey had its own baseline (AB and FE) and the resulting measurements were averaged to ensure a high level of accuracy.”
Image Copyright 2012 by Passy’s World of Mathematics
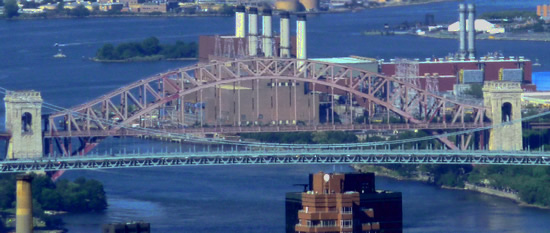
Imagine the shock Passy got two years ago while on top of the Empire State Building in New York City. There he spotted the above sight of the pink bridge which looked identical to the Sydney Harbour Bridge!
This New York bridge is a rail bridge called the “Hell Gate Bridge”, which was built before the Sydney Bridge. It is in fact this railway bridge which inspired Dr Bradfield’s design of the Sydney bridge.
The Sydney Harbour Bridge is 60% larger than Hell Gate.
Although not the longest arch span in the world, Sydney’s weight, width, and load capacity are greater than the world’s other major arch bridges.
Sydney Bridge was designed more than 85 years ago but has still not reached its maximum loading capacity.
The Bayonne Bridge is another steel through arch bridge in the USA, which connects New York state to New Jersey
Image Source: http://www.plansmartnj.org
It also resembles the Sydney Harbour Bridge, but was built after Sydney, and is longer and narrower than the Sydney Bridge.
The Runcorn Bridge in the UK was built in the early nineteen sixties, and is also a Sydney look-a-like steel through arch bridge.
Image Source: http://www.allertonoak.com
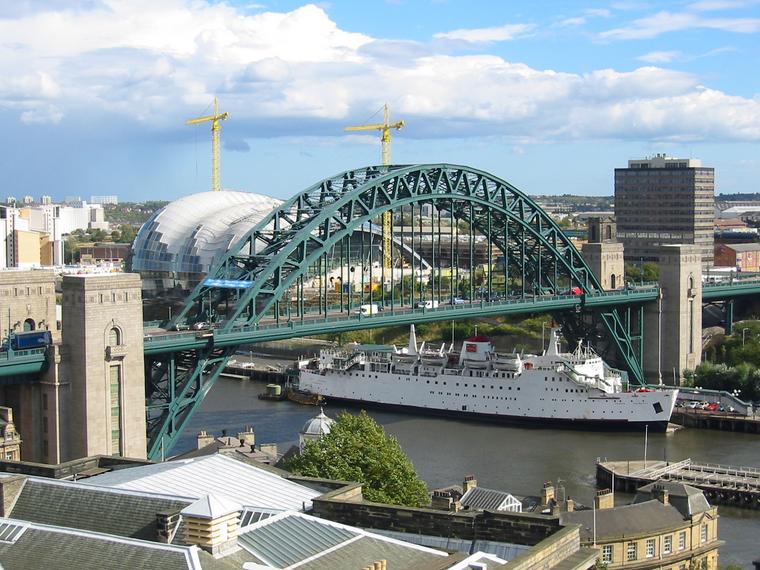
The Tyne Bridge (also in the UK) is a lot like the Sydney Harbour Bridge, but not nearly as big.
Image Source: http://danny.oz.au
It is erroneously thought by many people that the Sydney Harbour Bridge was a copy of the Tyne Bridge.
Information from the UK’s BBC website confirms that the much smaller Tyne Bridge was actually copied off the Sydney Harbour Bridge.
“Sydney was first to start work on its bridge and provided the template for the Tyne Bridge.
The Tyne Bridge was designed by Mott, Hay and Anderson who based their design on the Sydney Harbour Bridge.
This in turn was derived its design from the Hell Gate Bridge in New York.
It’s long been thought that the Sydney Harbour Bridge in Australia was based on the Tyne Bridge.
This is not the case and a quick look at the dates proves the case.
Work started on the Sydney Bridge before building began on the Tyne Bridge.
The confusion arises because the Sydney Harbour Bridge took longer to complete due to its larger size.
The Sydney Harbour Bridge finally opened in 1932, three years after the Tyne Bridge.”
Minecraft Sydney Harbour Bridge
The following video shows a “Minecraft” reproduction of the Sydeney Harbour Bridge.
There isn’t all the detailed triangulation, but the basic parabolic structure is a very good look a like.
Also notice in the build that there are less horizontal blocks at the beginning of each arch, and then progressively longer rows of horizontal blocks towards the top. This demonstrates the changing gradient properties of the parabolic shape quite well.
If you are a subscriber to Passy’s World of Mathematics, and would like to receive a free PDF containing the Bridge Measurements Photos, and accompanying instructions for a mathematics class to calculate the Bridge’s Quadratic Equations, 100% free to you as a Subscriber, then email us at the following address:
Please state in your email that you wish to obtain the free subscriber copy of the “Sydney Harbour Bridge Parabolas” PDF.
Email Subscription to Passy’s World is Free. To find out exactly how free subscription works, click the following link:
While you are there, LIKE the page so you can receive our FB updates to your Facebook News Feed.
Help Passy’s World Grow
Each day Passy’s World provides hundreds of people with mathematics lessons free of charge.
Help us to maintain this free service and keep it growing.
Donate any amount from $2 upwards through PayPal by clicking the PayPal image below. Thank you!
PayPal does accept Credit Cards, but you will have to supply an email address and password so that PayPal can create a PayPal account for you to process the transaction through. There will be no processing fee charged to you by this action, as PayPal deducts a fee from your donation before it reaches Passy’s World.
If you enjoyed this lesson, why not get a free subscription to our website. You can then receive notifications of new pages directly to your email address.
Go to the subscribe area on the right hand sidebar, fill in your email address and then click the “Subscribe” button.
To find out exactly how free subscription works, click the following link:
If you would like to submit an idea for an article, or be a guest writer on our website, then please email us at the hotmail address shown in the right hand side bar of this page.
Feel free to link to any of our Lessons, share them on social networking sites, or use them on Learning Management Systems in Schools.
Airports can sure get busy, but not to the extent of the above photo-shopped masterpiece !
Airlines use “Hub Networks”, which are actually multiple Hub and Spoke structures that are interconnected to each other by multiple paths.
Image Source: http://www.proaerobusiness.com
In the Airline Network Routes diagram above, the large black dots represent “Hub” Airports.
Hub Airports have many connecting flights flowing through them, and so it is possible to get to any far away destination by first getting to a Hub Airport.
This means that for a person flying from one remote location to another, they can always do this in only two steps, with the middle step being a Hub Airport.
Most major airlines have multiple Hubs. Hubs allow them to offer more flights for passengers, and fill more seats on each flight, which means they are more cost efficient.
There is a good short article about Airline Networks at the following web page:
The world’s largest Network, The Internet, is also a Network of Hubs.
Image Source: http://www.visualcomplexity.com
Efficient networks which carry a lot of traffic are always designed with plenty of hubs, as well as many connected crossing paths, so that if one path is not available between two locations, then alternative paths can be used.
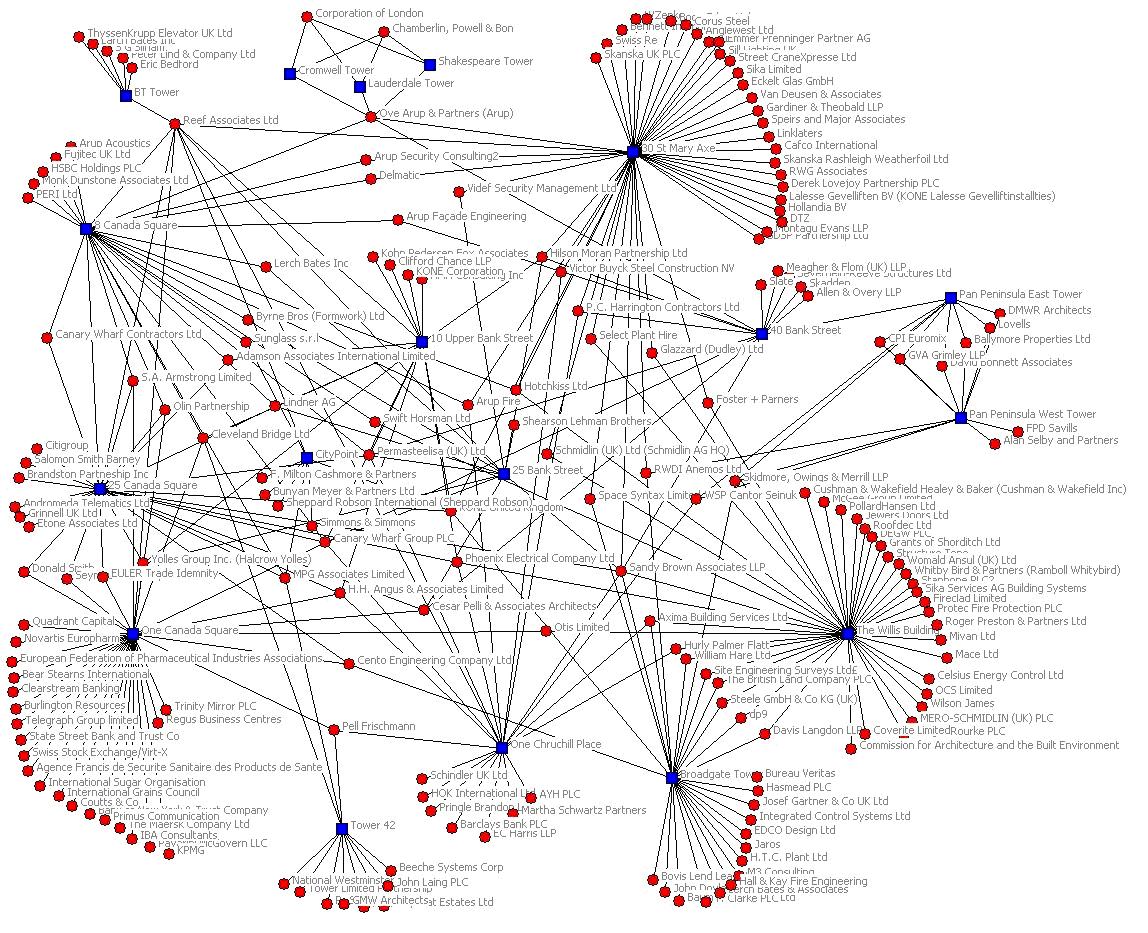
The following diagram is an excellent example of a typical large scale real life network. (Click the image to go full size)
Image Source: http://4.bp.blogspot.com
Hubs and many alternative paths create a fast efficient Network for passge between any two points on the Network.
But what if we are traveling a Network and need to visit several specific points on the network one after each other?
For example, a Postman delivering items needs to visit many locations, but does not want to travel down the same street to the same location twice.
In this situation the Postman needs a different Network Structure for maximum efficiency, which is called a “Traversable” or “Transversable” Network.
In the remainder of this lesson we will be looking at the Mathematics of Traversable Networks.
Definition of a Traversable Network
A “Traversable Network” is one where we can find a route through the network, along the edges, that uses all of the edges only once.
A network is said to be traversable when it is possible to start at a “Vertex” (or “Node”), and trace out the whole network without having to retrace over any of the connector “Edges”.
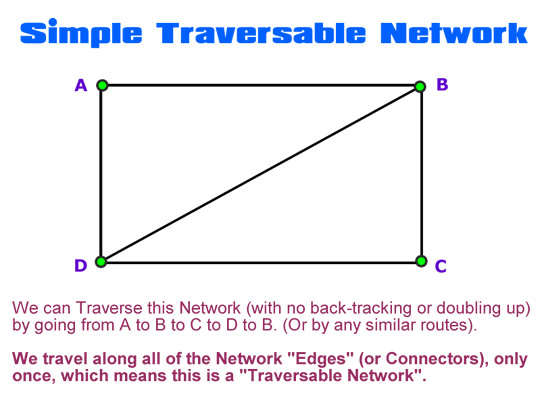
The following is a Traversable Network, because we can easily get around the Network traveling along each Edge (or connector) only once.
Image Copyright 2012 by Passy’s World of Mathematics
Note that when we trace fully around a Network, we do not have to get back to our starting point.
As long as we move along all connector “Edges” with no repeats, we have “Traversed” the Network. We can then say that the Network is “Traversable”.
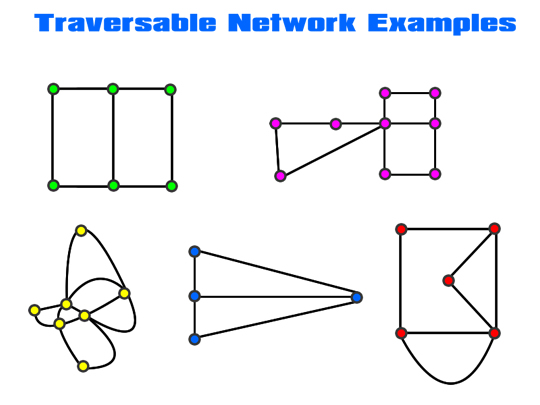
If we manually trace around each of the following Networks, we should find that they are all Traversable.
Image Copyright 2012 by Passy’s World of Mathematics
Video About Traversable Networks
The following video is a good introduction to Traversable Networks
Traversable Network Rule
The following mathematical rule overcomes the difficulties of trying to manually trace a unique traversable path through any Network.
It is far easier to do some calculations and apply this rule, than to do complicated manual tracing.
For a network to be traversable, it must be fully connected.
A connected network is traversable if:
all vertices are of even degree; or
exactly two vertices are of odd degree and the rest are of even degree.
If a network has more than two vertices of odd degree, it is not traversable.
The “Degree” (or “Level”) of a vertex is how many Edges are connected into it.
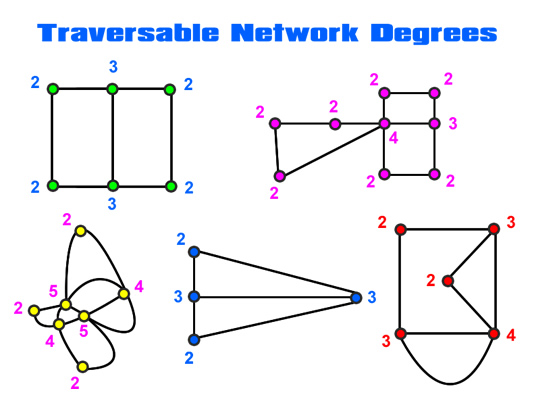
If we go back to our previous Traversable Network examples, we can see that they are all Connected Networks.
We can then label the “Degrees” for each Vertex, and see that they all follow the above Traversable Rule.
This is shown in the following diagram.
Image Copyright 2012 by Passy’s World of Mathematics
All of the Networks in this diagram are connected Networks.
All of the Networks have no more than two Odd numbered Degrees (or Levels) values on their Vertices.
We can also manually trace over these Networks by hand, and see that they are indeed Traversable. Eg. For each Network we can find a route which passes along all of the Edge paths, without repeating any of the paths.
Hint: When manually tracing over a traversable network by hand, which has odd degree vertices, always start at one of the odd vertices.
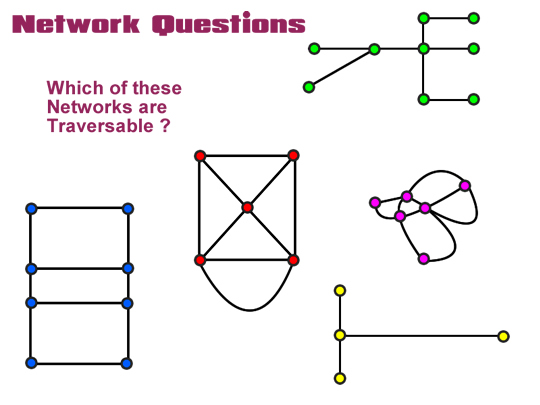
Traversable Network Questions
Using the Connected Degrees Rule, find out which of the following Networks are Traversable.
Image Copyright 2012 by Passy’s World of Mathematics
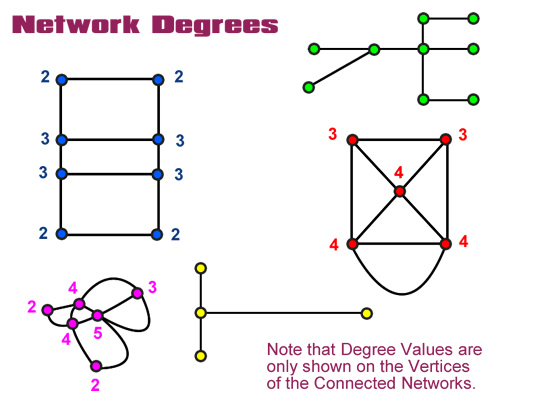
Answers to Traversable Network Questions
The Green and Yellow Networks cannot be Traversable, because they are not fully connected Networks. They each have several end point Vertices of Degree 1, which also breaks the “not more than two odd numbers” rule. Finally we cannot manually trace along all the “Edge” connectors of these Networks without doing repeats. They are both definitely not Traversable.
The Blue, Red, and Pink Networks are shown below with their Vertex Degrees labelled.
(Remember the “Degree” or “Level” of each Vertex dot, is the number of connector Edges attached to that Vertex dot.)
Image Copyright 2012 by Passy’s World of Mathematics
The Blue Network is not Traversable because it has more than two vertices of odd degree. Eg. There are four vertices with Degree equal to the odd number 3, and we are only allowed to have a mximum of two odd numbered Vertices.
The Red Network is Traversable, as it only has two Vertices of odd Degree “3”, and the rest of its vertices are even numbered values.
We can fully Traverse the Red Network with no repeats if we start at the end of the loop, go around the loop, and then up and around the square following its trianges.
The Pink Network is Traversable because it has only two Vertices of odd Degree (“5” and “3”), and the rest of the vertices are even number values.
We can manually traverse the Pink Network, but finding the exact route which is Traversable is fairly challenging.
Networks and Six Degrees of Separation
The Mathematics of Networks involves a wide variety of everyday situations from social interactions to biochemistry.
The following video covers the idea of hubs in Networks making any member of the network separated from another member by a maximum of six connections.
Additional Information
The “Coburg General Maths” site on Edublogs has some great notes on Networks for Senior High School Students:
The following web page by Sonja Stankovic has an excellent solution to the classic “Konisberg Bridges Question”, as well an interesting Network Question on Airline Flight Routes.
Each day Passy’s World provides hundreds of people with mathematics lessons free of charge.
Help us to maintain this free service and keep it growing.
Donate any amount from $2 upwards through PayPal by clicking the PayPal image below. Thank you!
PayPal does accept Credit Cards, but you will have to supply an email address and password so that PayPal can create a PayPal account for you to process the transaction through. There will be no processing fee charged to you by this action, as PayPal deducts a fee from your donation before it reaches Passy’s World.
If you enjoyed this lesson, why not get a free subscription to our website. You can then receive notifications of new pages directly to your email address.
Go to the subscribe area on the right hand sidebar, fill in your email address and then click the “Subscribe” button.
To find out exactly how free subscription works, click the following link:
If you would like to submit an idea for an article, or be a guest writer on our website, then please email us at the hotmail address shown in the right hand side bar of this page.
Feel free to link to any of our Lessons, share them on social networking sites, or use them on Learning Management Systems in Schools.
Image Copyright 2012 by Passy’s World of Mathematics
Rail Networks are quite familiar to most of us. Recently Passy visited Sydney in Australia, and found the rail network system to be far superior to that of Melbourne.
The Melbourne Rail Network is an old fashioned “Hub and Spoke” Network as shown below.
(Click the above image to go Full-size).
This means that to get to many places we have to go into the City and then back out again. It also means that all trains have to go into the city loop and then back out again.
The Sydney Network is a “Looped Network” with several hubs, which makes getting around much easier, since there are many more options for taking train routes to various destinations.
This is shown in the diagram below.
(Click the above image to go Full-size).
Rail Networks are just one kind of Network.
There are also Electricity Distribution Networks, Mobile Phone Networks, Neurological Networks in humans and animals, Road Networks, Distribution Networks, Computer Networks including the Internet, Social Networks, Terrorist Networks, and many others.
In this lesson we look at the basic Mathematics of Networks.
Networks and Social Networking
The following video is an excellent introduction to Networks, including an overview of Social Networks.
Mathematical Components of a Network
“Networks” belong to an area of mathematics called “Topology”.
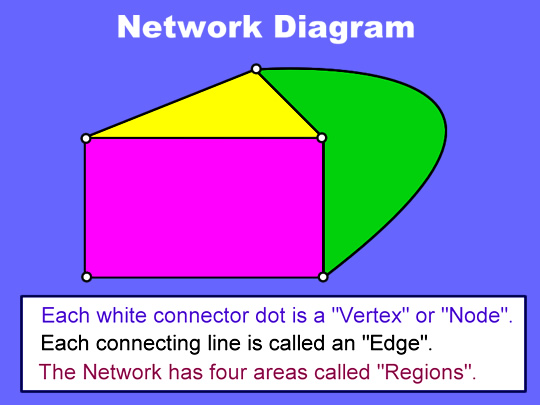
Networks contain “Vertices” (or dots), “Edges” (or Connector Lines and Curves), and “Regions” (or Areas).
Here is a typical basic Network Diagram.
Note that we have coloured in the Regions; however network diagrams are not usually coloured in like this.
Image Copyright 2012 by Passy’s World of Mathematics
There are four Areas or “Regions” on the above diagram, because the outside Blue area is also counted as a Region.
There are five “Vertices” on the diagram which connect together the lines and curved edges.
The above Network has seven “Edges”. (Note that Edges can be straight lines or curves).
Network Equation
There is an equation which works for every Network, and is useful for checking answers.
The Equation is:
Regions + Vertices = Edges + 2
In our sample Network shown previously, substituting into the above Equation gives:
4 + 5 = 7 + 2
If the equation does not work out equal on both sides for a Network, then one of our counts of the Vertices, Edges, or Regions must be incorrect, and we need to go back and check through our work.
Network Examples
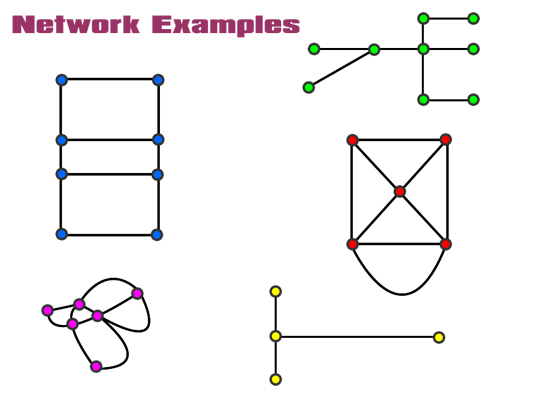
In the following examples, work out how many “Vertices”, “Edges”, and “Regions” there are.
Remember to also count the area outside each Network as a Region.
Also check your answers using the Network Equation: R + V = E + 2
Image Copyright 2012 by Passy’s World of Mathematics
Answers to Examples
The Blue Network has 4 Regions, 8 Vertices, 10 Edges, and R + V = E + 2 gives 4 + 8 = 10 + 2
The Green Network has 1 Region, 9 Vertices, 8 Edges, and R + V = E + 2 gives 1 + 9 = 8 + 2
The Red Network has 6 Regions, 5 Vertices, 9 Edges, and R + V = E + 2 gives 6 + 5 = 9 + 2
The Pink Network has 6 Regions, 6 Vertices, 10 Edges, and R + V = E + 2 gives 6 + 6 = 10 + 2
The Yellow Network has 1 Region, 4 Vertices, 3 Edges, and R + V = E + 2 gives 1 + 4 = 3 + 2
Tree Diagram Network
Image Source: http://www.syque.com
A tree diagram is a special type of open network. This Network has only one Region, but many Vertices and Edges.
In this “Tree” topology, any two vertices are connected by exactly one path.
Each vertex connects to one or more other Vertices, making the Network branch out into more and more paths that can be taken from the original starting point.
Tree Diagrams are useful for organising tasks, and classifying situations into groupings. They are also used for breaking down complex items into sub-groups of simpler items.
Colouring in Networks
Most Maps contain borders of Suburbs, States, or Countries on them which form a Network of Edges.
These will form enclosed regions when we colour them in.
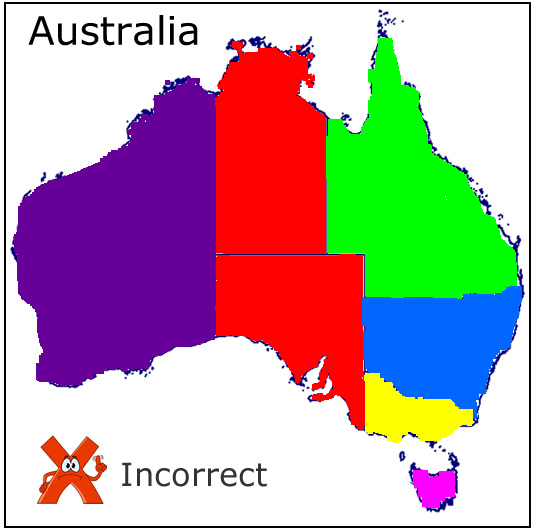
The rule for colouring in such diagrams is that two adjoining Regions next to each other must not be shaded in the same colour.
Not every region has to be a different colour, but we need to make sure we separate regions using colours, and do not have two regions next to each other as the exact same colour.
This is shown in the following example of the map of Australia and its States.
This first example is incorrect, because the two middle states have been coloured in the same red colour. This makes it appear as though they are one region instead of two separate regions.
Image Copyright 2012 by Passy’s World of Mathematics
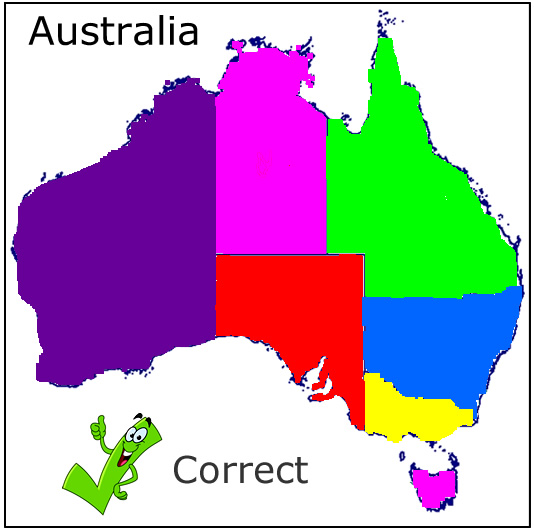
The next example shown below is correct, where all regions can be seen as being separate from each other. It does not matter that we have used the colour pink for two separate regions, because they do not touch each other on the map.
Image Copyright 2012 by Passy’s World of Mathematics
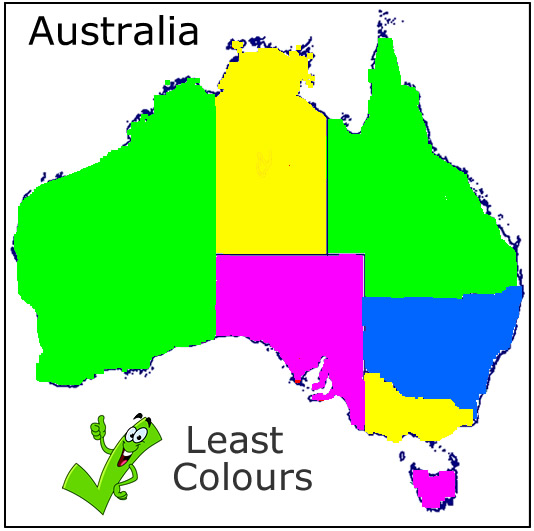
If we were asked to colour the map in using the least number of colours possible, then the following would be one of several possible correct solutions that use only four colours.
Image Copyright 2012 by Passy’s World of Mathematics
Flow Networks
Image Source: http://cauchoscastilla.com
If we add capacity to a network structure, such as liquids flowing through a network of pipes at an oil refinery, then we have a “Flow Network”.
A flow must satisfy the restriction that the amount of flow into a node (or Vertex) equals the amount of flow out of it, except when it is a source, which has more outgoing flow, or a sink, which has more incoming flow.
A flow network can be used to model traffic in a road system, fluids in pipes, currents in an electrical circuit, or anything similar in which something travels through a network of nodes.
There is a good overview of Flow Networks on Wikipedia, at the following web page:
In the following video, Dr. Chris Bishop explains an interesting paradox that shows how the removal of very fast roads, (like removing a tunnel through the middle of a city), can actually reduce average journey times.
Additional Information
There is a great introduction to Network Mathematics written by Bruce Hoppe at the following web page:
If you enjoyed this post, why not get a free subscription to our website. You can then receive notifications of new pages directly to your email address.
Go to the subscribe area on the right hand sidebar, fill in your email address and then click the “Subscribe” button.
To find out exactly how free subscription works, click the following link:
If you would like to submit an idea for an article, or be a guest writer on our blog, then please email us at the hotmail address shown in the right hand side bar of this page.
Feel free to link to any of our Lessons, share them on social networking sites, or use them on Learning Management Systems in Schools.
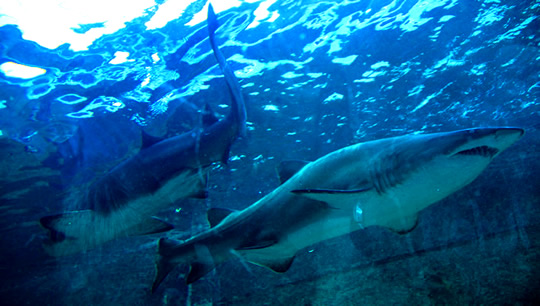
Image Copyright 2012 by Passy’s World of Mathematics
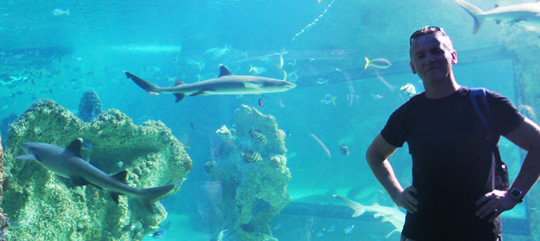
Passy’s World recently visited the Sydney Aquarium in Australia, which has one of the world’s best Shark exhibits.
In this lesson we look at some of the mathematics associated with these amazing creatures.
Image Copyright 2012 by Passy’s World of Mathematics
Mathematical Hunting Patterns
Sharks and other predatory sea animals actually use math when they hunt, according to scientific research.
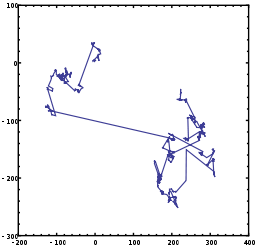
The study, published online in the journal “Nature” in June 2010, found that some animals move in a specific pattern called a “Levy Walk”.
On a graph, the Levy Walk, which consists of rare, long forays in one direction, has a squiggly pattern and its shape stays the same no matter what the viewing scale is.
Computer models suggest Lévy flight is the optimal search pattern for predators in low-prey areas, and maximizes the chance of a random encounter. Visually speaking, a Lévy flight is characterized by short movements in random directions, interspersed with occasional longer trips in a particular direction.
Information Source: http://articles.nydailynews.com
Here is what a “Levy Walk” can typically look like:
Image Source: http://upload.wikimedia.org
Levi path lengths have been used to help make clusters of computers along a network more efficient, and are also one method of searching for vessels or people lost at sea, or for finding your friends in a large crowd at an outdoor concert!
Shark Sizes
Image Source: http://newspaper.li
The Great White Shark is the biggest Shark that most people have heard about, and it’s length can be up to six and a half meters long.
However Scientists have found remains of a much larger ancient shark called the “Megalodon”.
Using mathematics and computer modelling they have been able to determine the size of the Megalodon as much bigger than the Great White, as shown in the diagram below.
Image Source: http://newsimg.bbc.co.uk
Megalodon ate seals, whales, and tortoises, and it is believed Megalodons became extinct because Orca Killer Whales ate the food sources of the Magalodon, and Great White Sharks preyed on many baby Megalodon pups.
Here is a short Discovery Channel video about the Megalodon.
In the above photo scientists at Houston’s Science Museum construct a Megalodon Shark Jaw containing a total of 178 teeth in four rows, including 72 teeth that are actual Megalodon fossils. There is plenty of measuring and mathematics involved in getting a model like this looking as good as these guys have.
Note the mathematical Parabolic shape of the shark teeth. Shark fins are also half Parabolas, and so there is some very interesting mathematics going on in their body parts.
By looking at the mathematical distribution of stress and strain on shark jaws, scientific researchers have found that the largest great whites have a bite force of up to 1.8 tonnes, three times the biting force of an African Lion, and 20 times harder than a human can bite.
Dr Stephen Wroe of the University of New South Wales, used a technique known as finite element analysis to compare the skulls of the Great White with that of the prehistoric Megalodon.
The approach is a common one in advanced design and manufacturing, and allows engineers to test the performance of load-bearing materials, such as the metal in the body and wings of aeroplanes.
CT (X-ray) scans were taken of Megalodon remains to construct a high-resolution digital model of the ancient shark’s head and jaws.
Megalodon’s biting force has been mathematically determined to be up to ten times more powerful than the Great White, which makes it 200 times more powerful than a human bite. It is estimated that Magalodon could bite down with a force of between 10.8 to 18.2 tonnes.
Dr Wroe’s research team said that biting with such force was quite a feat given that the jaws of these ancient creatures were made of flexible cartilage.
In contrast to most other fish, sharks’ skeletons are made up entirely of cartilage. Scientists think that cartilage, being a much lighter material than bone, is one adaptation that allows sharks to swim without the aid of a swim bladder.
The shark’s upper jaws can be dislocated: the whole upper and lower jaw pull out and forward as the shark twists and shakes its head from side to side to bite a chunk out of its prey.
These sharks feed on very large prey: the great white shark eats sea lions and the megalodon is thought to have eaten whales.
These sharks ambush their prey and immobilise them with a bite, then wait for them to die. They are actually delicate feeders and take care not to damage their teeth by biting down too hard on the large bones of their prey.
To keep their teeth sharp, sharks have a battery of them that is continually replaced. This is why they have rows of teeth in their huge mouth. These rows of teeth are also angled backwards so that their prey cannot escape.
It is the combination of their size, their razor-sharp teeth and the element of surprise that makes sharks such deadly predators.
Information Source: http://news.bbc.co.uk
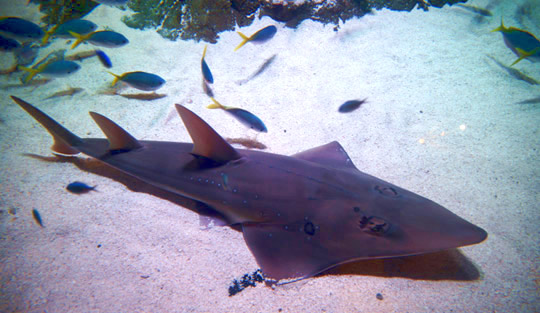
The Guitar Fish
Image Copyright 2012 by Passy’s World of Mathematics
The fish in this picture is not actually a Shark.
It is a “Guitar Fish” which is one of Passy’s favorite fishes at the Sydney Aquarium. It’s triangular geometry is simply stunning.
Despite its shark like appearance, being grey with two large dorsal fins, guitar fish are actually quite harmless. They are found in shallow warm water areas of Australia.
If you are ever in Sydney Australia, then the Sydney “Sea Life” Aquarium is definitely worth a visit.
To download the PowerPoint Presentation from the Mathematics Association of Victoria Conference, click the link below and save the file to your computer.
Click the link below to download this 2MB PPT File:
If you enjoyed this post, why not get a free subscription to our website. You can then receive notifications of new pages directly to your email address.
Go to the subscribe area on the right hand sidebar, fill in your email address and then click the “Subscribe” button.
To find out exactly how free subscription works, click the following link:
If you would like to submit an idea for an article, or be a guest writer on our blog, then please email us at the hotmail address shown in the right hand side bar of this page.
Feel free to link to any of our Lessons, share them on social networking sites, or use them on Learning Management Systems in Schools.
Like Us on Facebook
Our Facebook page has many additional items which are not posted to this website.
These include items of mathematical interest, funny math pictures and cartoons, as well as occassional glimpses into the personal life of “Passy”.
While you are there, LIKE the page so you can receive our FB updates to your Facebook News Feed.
Help Passy’s World Grow
Each day Passy’s World provides hundreds of people with mathematics lessons free of charge.
Help us to maintain this free service and keep it growing.
Donate any amount from $2 upwards through PayPal by clicking the PayPal image below. Thank you!
PayPal does accept Credit Cards, but you will have to supply an email address and password so that PayPal can create a PayPal account for you to process the transaction through. There will be no processing fee charged to you by this action, as PayPal deducts a fee from your donation before it reaches Passy’s World.
Feel free to link to any of our Lessons, share them on social networking sites, or use them on Learning Management Systems in Schools.
Visitor Statistics
User Feedback
We love hearing from our Users. Email us at the hotmail address shown below with any comments, ideas for articles, or to report any broken links or blank images on our pages.