Image Source: http://www.floridatoday.com
In the next couple of lessons we are looking at the Mathematics of Retail Businesses.
This will involve using Buying Selling and Discounting Formulas.
This includes the retailer getting goods to sell, and applying a price increase so that they can make money on each sale.
The money that the Retailer makes from selling an item is called the “Profit”.
Discounts that occur during sales are also covered.
Finally, the sad situation of selling goods at a “Loss” is also covered.
To work out the mathematical answers required for Retailers and Buyers of products, we use various Maths Formulas.
The tricky bit is figuring out which formula to use for a given retail situation. Several practical examples are given to help people get good at this.
Definitions for Items in Formulas
Cost Price
The Cost Price is how much it costs a retailer to buy items they are going to sell from suppliers or from overseas.
Mark Up
The Mark Up is extra money that the retailer adds on before putting a final price on the item.
Marked Price
This is the final price of the item. The Marked Price is then written onto the tag or sticker that is put onto the item in the shop.
This is the price the customer has to pay for the item and is also often called the full “Recommended Retail Price” or “RRP”.
If the item is NOT on discounted sale, then the customer has to pay the full RRP that is on the item’s tag or sticker.
Discount
If the shop is having a Sale, you do not have to pay the full Marked Price on the item. This is because the retailer gives you some money off the full normal price to create a lower than normal “Sale Price”.
Sale Price
The Sale price is the price the customer ends up paying for the item.
If the item is on sale for a discounted price, the Sale Price (sometimes called the “Selling Price”), will always be lower than the full normal Marked Price.
But if the item is not on sale, the customer will have to pay the full normal Marked Price.
Profit
Retailers sell items for more than it cost to get them, (even when the items are on Discount Sale). This allows the Retailer to make some money.
The money that the retailer makes from selling the item is called the “Profit”.
Loss
Sometimes a retailer will get into money problems, or have more items than they can fit in their shop or warehouse.
When this happens they have to sell goods at desperately low prices to get money to pay for shop rent, wages, electricity, transport, etc.
If they do not take this desperate step, they will get into huge debt and go out of business.
If they have to sell an item for less money than it originally cost them, then they will lose money on that item.
Losing money on a sale because the Sale Price is really really low, is called “Making a Loss”.
GST – Goods and Services Tax
Most goods in Australia are subject to a 10% “GST” Tax, except for some basic grocery and food items.
This means that 10% tax is included in the price the customer pays.
When a Retailer gets the original item at Cost Price, then does the Mark Up, then might give a sale Discount, there is a resulting final price the customer is going to pay.
In most cases, 10% of the money which the Retailer gets from the Sale has to be forwarded by the Retailer to the Goverment as GST.
Retailers need to be aware in their Financial Planning that 10% of all their profits are taken away by the Government as GST Tax.
This means that Retailers need to average more than 10% Profit on their Sales. Otherwise they will not make any money and will go out of business.
Cost Price, Mark Up, and Marked Price

Image Source: http://www.star1045.com.au
Tommy and Tamara’s TV Shop gets a Samsung TV from Asia at a cost of $1000.
They need to sell the TV for more than $1000 so they can cover their running costs such as shop rental, electricity, accounting costs, taxes, and so on.
To do this they put a “Mark Up” of 80% on the TV to create the “Marked Price” that will be on the sale sticker on the TV in their shop.
The “Cost Price” of the TV was $1000
80% of $1000 = $800
This means the “Mark Up” added onto the original Cost Price will be $800.
This makes the “Marked Price” of the TV become $1800.
The Mathematics of this is summarised in the following diagram:
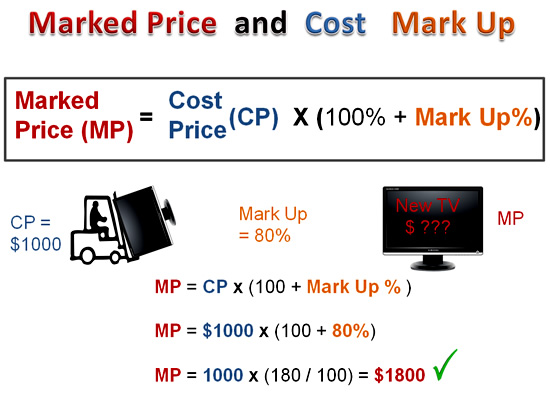
Image Copyright 2012 by Passy’s World of Mathematics
Marked Price – Working Backwards

Image Source: http://cdn.sheknows.com
Tommy and Tamara have a Panasonic TV for sale in their shop with a Marked Price of $1600.
If we know that the Mark Up % on this TV is 90%, what was the original “Cost Price” of the TV ?
This question if a “working backwards” Marked Price question.
From working with Algebra Equations, we know that working backwards involves applying opposite operations.
Our previous Marked Price Formula had MULTIPLICATION in it, so we need to change this to use DIVIDED BY.
Here is how we work out the above Panasonic TV question:
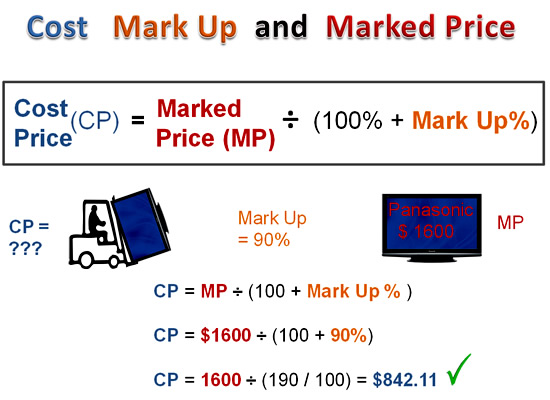
Image Copyright 2012 by Passy’s World of Mathematics
Marked Price – Video
Here is a Quick Video about Markup
Marked Price – Summary
The following diagram shows a summary of the formulas we use for questions which involve Marking Up products.

Image Copyright 2012 by Passy’s World of Mathematics
Selling Price

Image Source: http://www.goldrushstores.com
The Price the customer pays of an item is called the item’s Selling Price.
The Selling Price is how much it costs the customer to buy the item.
If there is no Discount on the item, then the customer has to pay the full Marked Price that is on the item.
If the customer gets a Discount, (eg. money taken off the full price because it is on sale at a certain percentage reduction), then the Selling Price is the Marked Price take away the Discount.
This is summarised in the following diagram.
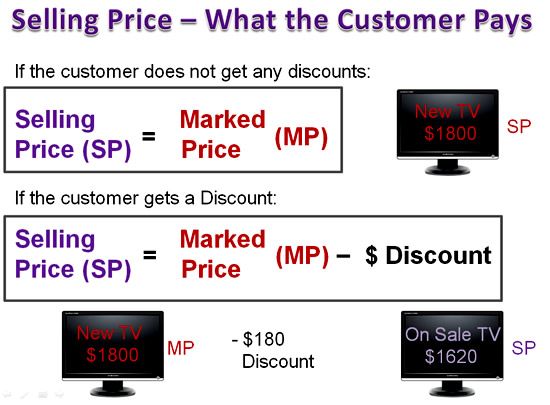
Image Copyright 2012 by Passy’s World of Mathematics
Mark Up Formulas Summary
Here are the main formulas we use for working with Mark Ups.
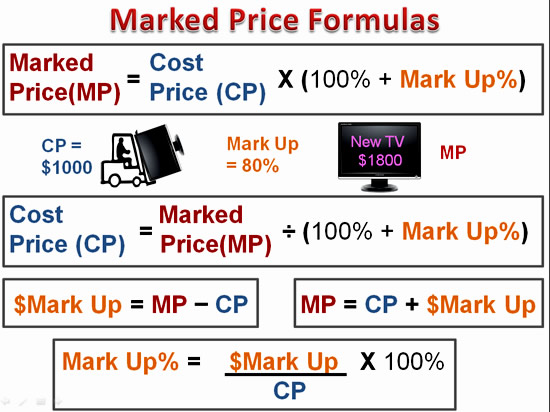
Image Copyright 2013 by Passy’s World of Mathematics
These need to be copied down into the maths notes for Discounts in your workbook.
How to Select the Correct Formula

Image Source: http://info.sybiz.com
To choose the best formula to use for a financial mathematics word problem, we do these steps:
1) Identify the unknown – eg. what is it we need to find the missing value of (Marked Price, Cost Price, Mark Up $, %Mark Up, etc).
Make sure that the unknown item is on the left hand side of our formula.
2) Identify what is given to us in the problem out of Marked Price, Cost Price, Mark Up $, %Mark Up, etc.
Make sure the given items are on the right hand side of the formula.
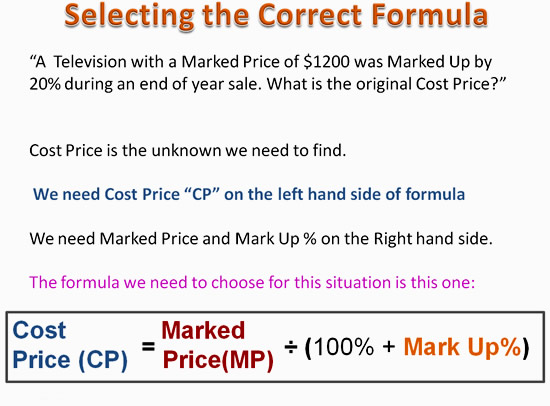
Image Copyright 2013 by Passy’s World of Mathematics
Dollar Profit
The “Profit” is how much money the Retailer makes on selling the item.
This dollar profit is the difference between how much the Retailer originally gets the item for, and how much the Retailer is able to sell the item for.
Dollar Profit = Selling Price – Cost Price
Remember that if there is no Discount, then the Selling Price is the full Marked Price on the Item.
This is summarised in the following diagram.
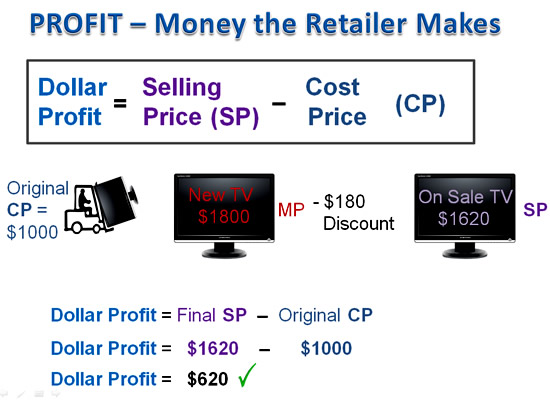
Image Copyright 2012 by Passy’s World of Mathematics
Percentage Profit
Profit is often expressed as a “Percentage Profit”.
There are two ways businesses used to express Percentage Profit as follows:
1) Percentage Profit based on the Cost Price
and
2) Percentage Profit based on the Selling Price
This can be very confusing for people new to Financial Mathematics. The trick is to read the given question or situation very carefully.
If the question just asks for “Percentage Profit” (and does not specify based on Selling or Cost), then calcualte the Percentage Profit based on the Cost Price.
Shown below is how we calculate the Percentage Profit based on the Cost Price for a TV which cost $1000 and was sold for $1620.
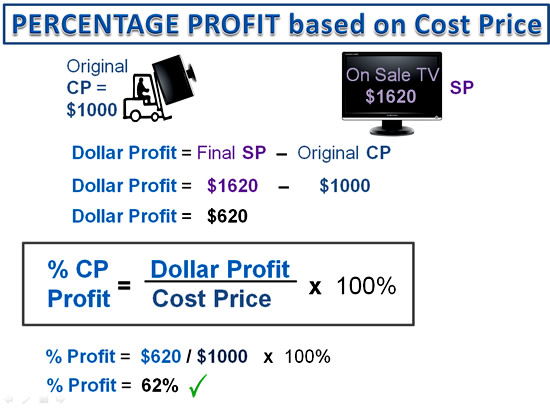
Image Copyright 2012 by Passy’s World of Mathematics
Shown below is how we calculate the Percentage Profit based on the Selling Price for a TV which cost $1000 and was sold for $1620.
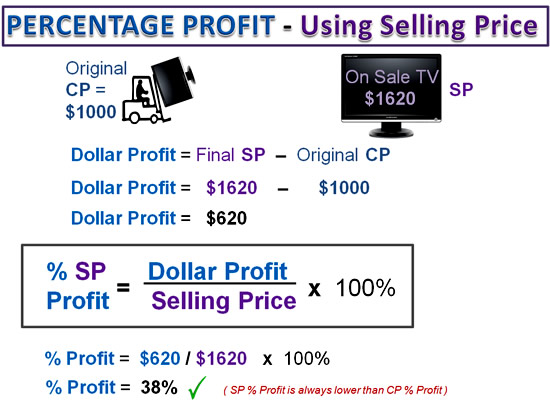
Image Copyright 2012 by Passy’s World of Mathematics
Percentage Profit and Gross Profit
The Percentage Profit based on the Selling Price is often referred to as the “Gross Profit”.
It is when we compare the Profit to how much we are making on an item compared to how much money that sale brings into our business.
The “Gross Profit” based on Selling Price is always lower than percentage claculated based on the Cost Price.
This is explained in the following video.
Profit Formulas Summary
Here are the main formulas we use for working with Profits.

Image Copyright 2013 by Passy’s World of Mathematics
These need to be copied down into the maths notes for Profits in your workbook.
Related Items
In our next lesson we will examine Discounts, Losses, and Goods and Services Tax. This will then complete our current work on Retail Mathematics
Help Passy’s World Grow
Each day Passy’s World provides hundreds of people with mathematics lessons free of charge.
Help us to maintain this free service and keep it growing.
Donate any amount from $2 upwards through PayPal by clicking the PayPal image below. Thank you!
PayPal does accept Credit Cards, but you will have to supply an email address and password so that PayPal can create a PayPal account for you to process the transaction through. There will be no processing fee charged to you by this action, as PayPal deducts a fee from your donation before it reaches Passy’s World.
If you enjoyed this lesson, why not get a free subscription to our website.
You can then receive notifications of new pages directly to your email address.
Go to the subscribe area on the right hand sidebar, fill in your email address and then click the “Subscribe” button.
To find out exactly how free subscription works, click the following link:
If you would like to submit an idea for an article, or be a guest writer on our website, then please email us at the hotmail address shown in the right hand side bar of this page.
Feel free to link to any of our Lessons, share them on social networking sites, or use them on Learning Management Systems in Schools.
Enjoy,
Passy