Image Source: http://image.popularhotrodding.com
This lesson is a quick look at Rocket Science and Cars.
It is all about Acceleration.
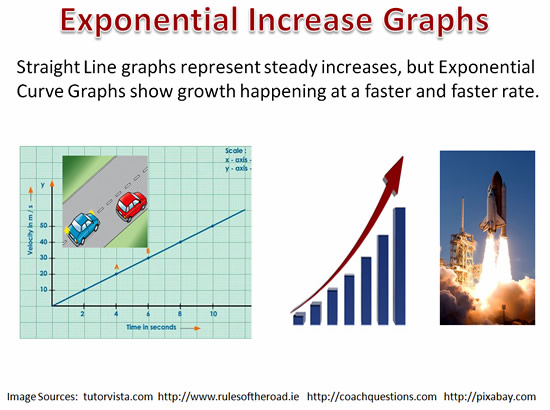
A normal car engine provides steady straight line acceleration for the car to overtake other vehicles.
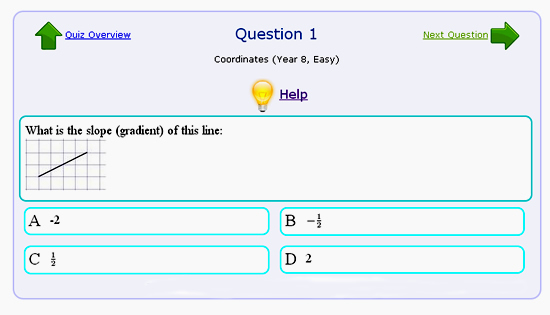
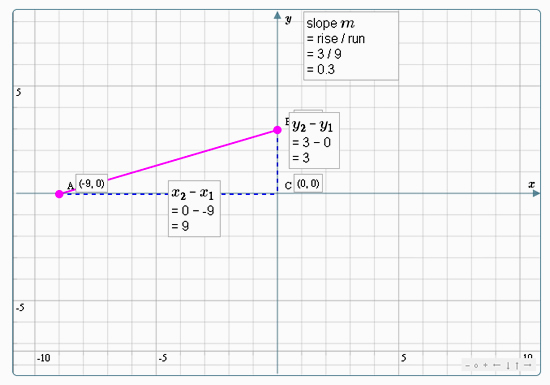
There is a particular steepness or gradient to the graph.
However, Rocket Engines provide massive acceleration for the large heavy rocket to be able to shoot up fast and escape the earth’s gravitational field.
So what happens when we attach a Rocket Engine to a Car ?
Well this has been done by the Mythbusters TV Show, as well as right here in Australia, during the filming of the original “Mad Max” Movie.
Myth Busters Jato Rocket Car
In this myth, an airforce pilot supposedly attached a rocket engine onto his car, with powerful tragic results.
The following videos show the Myth Busters episode about this.
What kind of Mathematics was involved?
– Calculating the power from the rockets and estimating how fast the car might go
– Calculating the correct geometry for mounting the rockets onto the car
– Calculating the geometry of the rocket mounting assembly, and the strength of the building materials needed, so it would be strong enough
eg. use steel rather than wood, and cross members for strength
– Working out the geometry of an internal cage with triangulation for strength to mount the remote control assembly
– Fine tuning and calibrating the remote control devices to drive the car like a human would
– Realign the centre of gravity of the car by attaching a heavy front bumper bar to counterbalance the weight of the rockets on the back
– Designing a special sized steering wheel on the remote controls to give the correct required radius of turn inside the car
– Estimating the Probability of how dangerous it would be to have a human occupant, and working out that the test car would definitely have to be remote controlled
– Estimating the Probability for all possible disastrous and dangerous events occurring, and taking appropriate safety precautions
– Working out where cameras would need to be positioned so that none of the action was lost
– Working out the size of a large enough flat area to run the experiment
Here are the videos of the Mythbusters episode.
Part 1 Video: – 15mins
Part 2 Video – 15mins
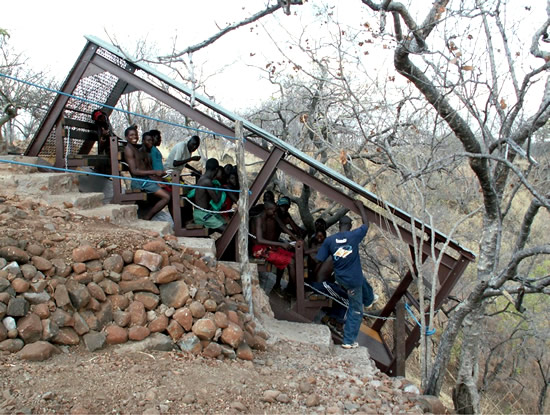
Although the myth was busted, the Mythbusters did one final additional test, involving building a ramp to use as part of the experiment.
Part 3 Video – Add a Ramp 13 mins
http://www.youtube.com/watch?v=q1TOKihjQuc
Mad Max Rocket Car
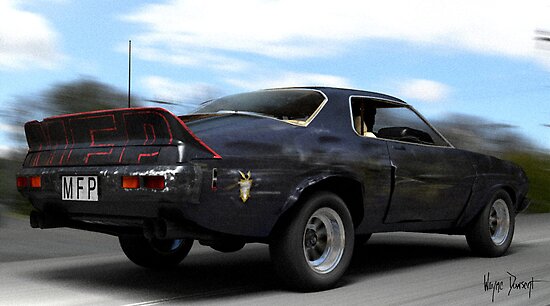
Image Source: http://ih1.redbubble.net
The original “Mad Max” movie made right here in Australia over 20 years ago, involved attaching a rocket to one of the cars for a particular scene.
The results were similar to the Mythbusters experience, in that the rocket provided too much power and made the car uncontrollable.
The Nightrider’s spectacular crash was the result of a military booster rocket being installed in the back of the car.
Passy worked as a Military Rocket Scientist a few years later, with some of the guys involved with building the rocket motor for the Mad Max Movie.
Although many mathematics calculations and tests had been performed, it was always suspected that the end result would be dangerous and unpredictable.
During the filming, the rocket mounted car went out of control, missed the target fuel tanker, and veered off into the field where it chased the film crew for a 1/4 mile.
The on-camera explosion was a later re-creation using a safer towed car.
The two sequences were then joined together to make the crash sequence that is in the Mad Max movie.
At the end of this YouTube video you can see where the Military Rocket fires off and the Nightrider’s car crashes.
Note that the movie clip is PG Rated, there does not appear to be any bad language, killing, or grotesque violence.

Image Source: http://content6.flixster.com
There is a Great Trivia Page on the original Mad Max Movie at the following link:
http://www.imdb.com/title/tt0079501/trivia
There is a new Mad Max Movie that should be out in 2014, and Mel Gibson is listed as being in the cast.
Well that’s it for our action packed Mathematics in Rocket Science lesson.
If you want to learn all about Rocket Science, then the “Midnight Tutor” has an excellent set of videos on the following YouTube Channel:
http://www.youtube.com/user/midnighttutor/videos
Related Items
The Cartesian Plane
Plotting Graphs from Horizontal Values Tables
Plotting a Linear Graph using a Rule Equation
Plotting Graphs from T-Tables of Values
Finding Linear Rules
Distance Between Two Points
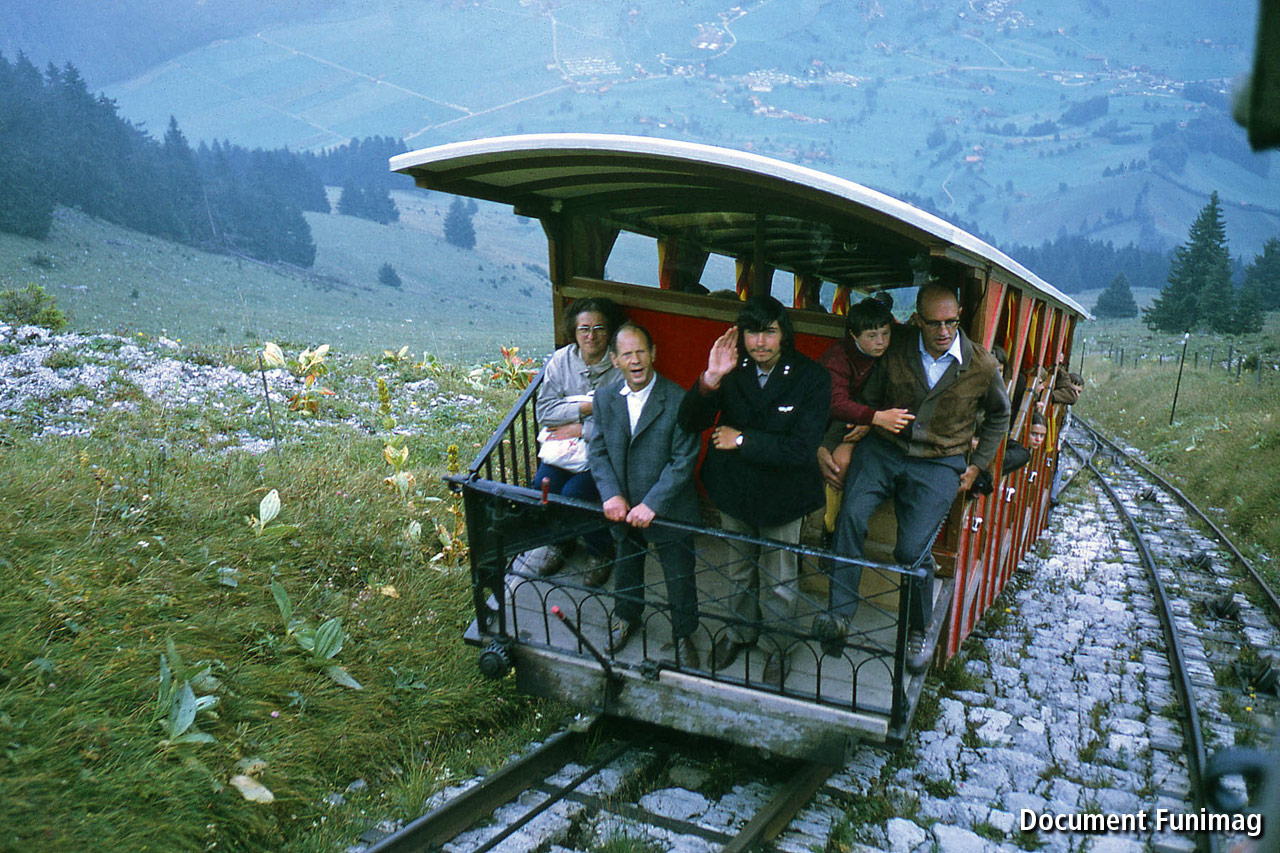
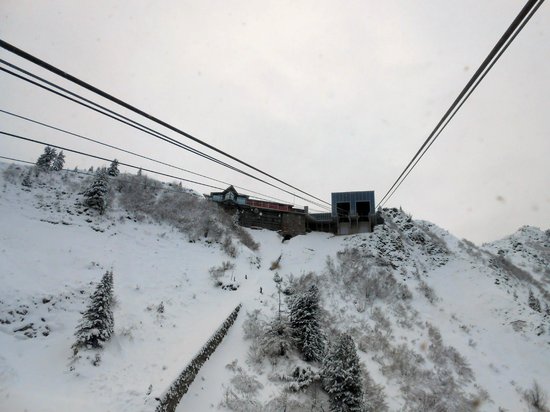
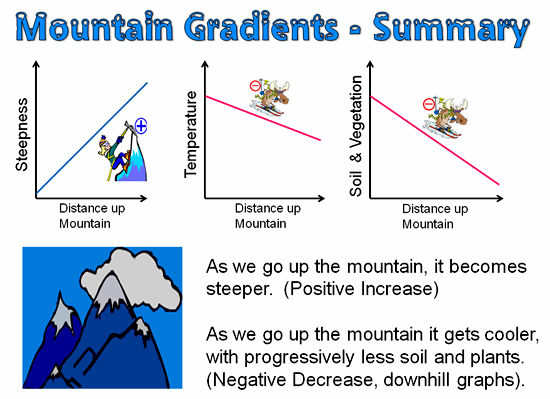
Mountain Gradients
Real World Straight Line Graphs I
Real World Straight Line Graphs II
Subscribe
If you enjoyed this lesson, why not get a free subscription to our website.
You can then receive notifications of new pages directly to your email address.
Go to the subscribe area on the right hand sidebar, fill in your email address and then click the “Subscribe” button.
To find out exactly how free subscription works, click the following link:
If you would like to submit an idea for an article, or be a guest writer on our website, then please email us at the hotmail address shown in the right hand side bar of this page.
Feel free to link to any of our Lessons, share them on social networking sites, or use them on Learning Management Systems in Schools.
Like Us on Facebook
Our Facebook page has many additional items which are not posted to this website.
These include items of mathematical interest, funny math pictures and cartoons, as well as occassional glimpses into the personal life of “Passy”.
Check it out at the following link:
https://www.facebook.com/PassysWorldOfMathematics
While you are there, LIKE the page so you can receive our FB updates to your Facebook News Feed.
Help Passy’s World Grow
Each day Passy’s World provides hundreds of people with mathematics lessons free of charge.
Help us to maintain this free service and keep it growing.
Donate any amount from $2 upwards through PayPal by clicking the PayPal image below. Thank you!
PayPal does accept Credit Cards, but you will have to supply an email address and password so that PayPal can create a PayPal account for you to process the transaction through. There will be no processing fee charged to you by this action, as PayPal deducts a fee from your donation before it reaches Passy’s World.
Enjoy,
Passy