

This lesson assumes that people already know how to draw basic Histograms.
If you do not know anything about Histograms, then click the link below to do our lesson on Basic Histograms:
http://passyworldofmathematics.com/basic-histogram-graphs/
Introduction to Grouped Data Histograms
Whenever we make a Histogram to go into a Business Report, or the Newspaper, or our Maths Work Book, we need a graph which has between 5 and 10 bars on it.
Graphs which have more than ten bars are sometimes necessary, but are very difficult to read, due to their size and complexity.

Image Source: http://www.vertex42.com
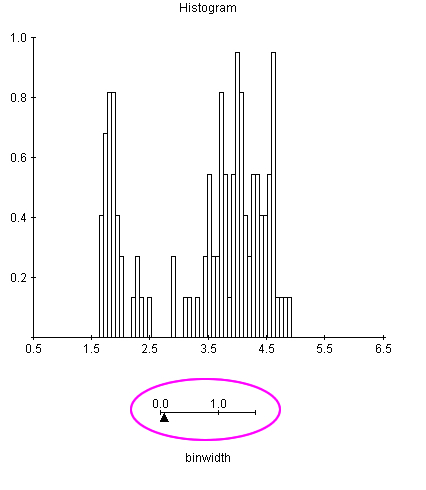
The following free online interactive demonstration is great for seeing how changing the “Bin Size” or “Class Interval Width” affects the number of resulting columns on a Histogram.
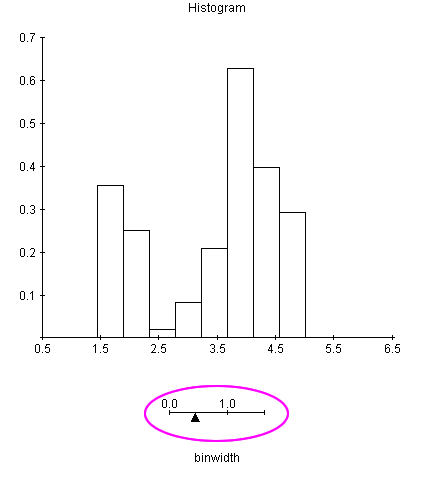
Simply adjust the slider below the graph to change the effect.
Eg. Narrow Intervals or Bins gives too many columns:
Having wider Intervals or Bins in the grouped data creates less columns, and makes a far more readable graph.
To use this free interactive online, click the following link:
http://www.stat.sc.edu/~west/javahtml/Histogram.html

To create smaller graphs from data with lots of different number values, we set up and use groups called “Class Intervals” or “Classes”.

Making a Frequency Table
The following is a Frequency Table which uses groups of data called “Classes” to summarise a survey of how many cappuccinos a Cafe was making per hour.

In the above Frequency Table:
Note that 0-3 means zero to three cups of coffee were made in a one hour period.
The “Frequency” value of “2” for this item means that there were two separate hours where this situation occurred.
Watch this video about making Frequency Tables.
[youtube http://www.youtube.com/watch?v=ipZzfE3Nk1I]
Drawing a Class Intervals Histogram
The following video shows how to make a Histogram where we use “Class” groups which are each covering a range of ten items.
Watch this video carefully, as it covers all the steps needed to draw a Histogram from a frequency table which has been supplied to you.
[youtube http://www.youtube.com/watch?v=BH-7Odhrt5Q]
This next video shows how to make a Class Intervals Histogram directly from a set of numbers, without drawing the actual Frequency Table.
[youtube http://www.youtube.com/watch?v=a6i2Ud0QlIk]
Getting the Grand Total From a Histogram
Here is a quick one and a half minute video about reading a completed Histogram to find out the total number of items graphed in the Histogram.
[youtube http://www.youtube.com/watch?v=HCDe14HKu-Y]
Class Intervals Histogram Example
The following example is for a survey conducted at a Cafe which sells food and coffees, such as Latte, Short Black, and Cappuccinos.
The person making the coffees in the shop, (the “Barista”), was complaining to the owner that so many people were ordering Cappuccino coffees that the existing machine could not cope with the customer demand.
The Barista suggested that they get another machine just for handling cappuccinos to solve this problem.
An extra machine is very expensive to buy, and so the owner had a two day survey done to find out how many Cappuccinos were being made per hour in the Cafe.
From the survey results, they would be able to make a graph, and better understand the current problem situation.

The first step is to calculate the “Class Width” or interval group size.
If we want to have 10 bars on our final Histogram, then we do the following calculation.

However, if we want a more compact Histogram with a total of only five bars, then we do this calculation:

We have decided to do a Five Bar Histogram for our Coffee Survey.
This means from the previous calculations that we will be using groups or classes that have a width of 4.
We start our first class as 0 to 3, (written as 0-3), which will contain counts for the four items 0,1,2, and 3.
Note that if we had a situation where it was not ever possible to have a zero value, (eg. Weight of a chocolate bar in grams), then we would do this:
Our very first value would be started at 1, and class width four intervals would need to be set up as 1-4, 5-8, 9-12, etc.
The following diagram shows how we tally our Coffee Survey data into a Frequency Table that contains all of our class width four groups.

We now draw our five bar Histogram directly from the completed frequency table to make our finished graph.

Conclusion
The completed graph shows that around one quarter of the time the Cafe is very busy making Cappuccinos, but the other one quarter of the time they are not very busy at all. Most of the time they are making 8 to 11 Cappuccinos per hour, which along with their other coffee offerings should be manageable.
There does not seem to be enough demand overall for Cappuccinos to justify buying a second coffee machine at this stage. They would probably be better off investigating upgrading their existing machine to be able to make more coffees faster. This would possibly involve replacing the existing machine with a newer higher capacity machine that can quickly make several cups of coffee at the same time.
Making Histograms Using MS Excel
The following Slideshare document shows how to make a Histogram in MS Excel.
Use the up and down arrow icons to move down through the document.
Make the document full screen by clicking on the bottom right hand icon. This will make it possible to read the screen prints clearly.
[slideshare id=8637768&doc=histograms-110719133007-phpapp01&type=d]
Related Items
Grouped Data Mean Median Mode
Basic Histogram Graphs
MS Excel Charts and Graphs
MS Excel Column Graphs and Pie Charts
Funny Graphs from Graph Jam
Real World Line Graphs
Averages – Mean Median Mode (including MS Excel)
Free Online Graph Makers
Misleading Graphs
Stem and Leaf Plots (Stem Plots)
Real World Charts and Graphs
If you enjoyed this post, why not get a free subscription to our website.
You can then receive notifications of new pages directly to your email address.
Go to the subscribe area on the right hand sidebar, fill in your email address and then click the “Subscribe” button.
To find out exactly how free subscription works, click the following link:
If you would like to submit an idea for an article, or be a guest writer on our blog, then please email us at the hotmail address shown in the right hand side bar of this page.

If you are a subscriber to Passy’s World of Mathematics, and would like to receive a free PowerPoint version of this lesson valued at $3.99, but 100% free to you as a Subscriber, then email us at the following address:

Please state in your email that you wish to obtain the free subscriber copy of the “Grouped Data Histograms” Powerpoint.
Enjoy,
Passy


Pingback: Averages – Mean Median Mode | Passy's World of Mathematics
Pingback: Online Graph Makers | Passy's World of Mathematics
Pingback: Misleading Graphs | Passy's World of Mathematics
Pingback: Stem and Leaf Plots | Passy's World of Mathematics
Pingback: Real World Charts and Graphs | Passy's World of Mathematics
Pingback: Basic Histogram Graphs | Passy's World of Mathematics
Pingback: Real World Line Graphs | Passy's World of Mathematics
Pingback: Online Graph Makers | Passy's World of Mathematics
Pingback: Grouped Data Histograms | Passy's World – Old Site
Pingback: Homepage
Pingback: Mean Median Mode for Grouped Data | Passy's World of Mathematics
Pingback: Symmetry and Skew | Passy's World of Mathematics
Pingback: Back to Back Stem and Leaf Plots | Passy's World of Mathematics
Pingback: Real World Charts and Graphs | Passy's World of Mathematics
Pingback: Misleading Graphs | Passy's World of Mathematics
Pingback: Introduction to Probability | Passy's World of Mathematics