Image Source: http://i.imgur.com
This ship is the “Blue Marlin”, one of the most amazing vessels to ever to sail the seas.
The Marlin can carry an incredible 75,000 tonnes.
It reaches a top speed of a sedate 13 knots, powered by a gigantic 17,000 horse power diesel engines, with a crew of 24.
(Note 13 Knots = 13 x 1.852 = 24 km / hr).
Steering it is said to be like controlling a floating office block.
The barges pictured above – which weigh a total of 60,000 tonnes – were exported from Korea to be completed in Rotterdam.
No crane in the world is big enough to lift these types of cargoes onto the Marlin’s deck, and an ingenious method is used to load the cargo.
The deck is submersible and can disappear under 13 metres of water when the Marlin’s ballast tanks are pumped full of water.
Boats, oil rigs and ships can then be floated on before the deck is raised again by emptying the ballast tanks.
There is a great article about the Blue Marlin at the following link:
Click here for Daily Mail Blue Marlin Newspaper Article
The following three minute video shows a giant oil rig that was built in Korea being loaded onto the Blue Marlin for transport to the USA.
Obviously there is some very exact mathematics involved here, because ships are designed via Archimedes Mathematical Principle to float rather than sink!
In this lesson we look at some of the Mathematics of Ships.
This includes Archimedes Floating Principle, as well as the Geometry of Hulls and Stabilisers.
We also look at Ship Stability, the Plimsoll Line, and the Mathematics of Loading Ships with Cargo.
How Ships Float

Image Source: http://twistedsifter.wordpress.com
Today’s colossal size cruise ships, such as the “Oasis of the Seas” and the “Allure of the Seas”, remain afloat thanks to buoyancy and displacement.
Ships are designed to displace the amount of water equivalent to their own mass.
The ocean meanwhile pushes up and keeps the ship afloat, or buoyant.
In other words, the pressure of the water pushing up on the bottom (or hull) of a cruise ship counteracts the downward force of the vessel’s gravity, thereby making it float on the water’s surface.
(Basically Positive and Negative Integer values cancelling themselves out to zero).
This basic idea is often referred to as “Archimedes’ Principle”.
According to this principle, an item floats when it displaces more than its own weight of the liquid that it’s immersed in.
The surrounding fluid pushes back with a force equal to that of the amount displaced, so that the two opposing forces are equal and the object floats.
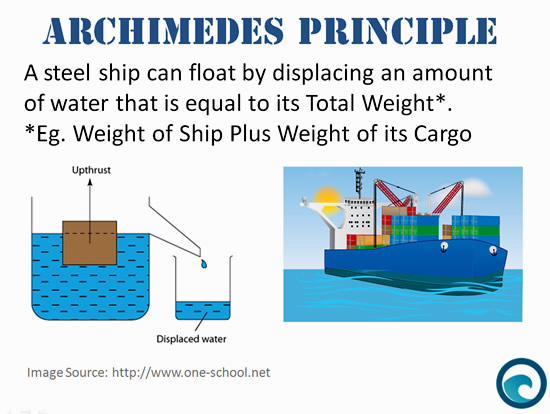
A Ship will float as long as it weighs less than the volume of water that its hull displaces.
The following one minute video explains Archimedes Principle
Tall Cruise Ships

Image Source: http://www.cruiselawnews.com
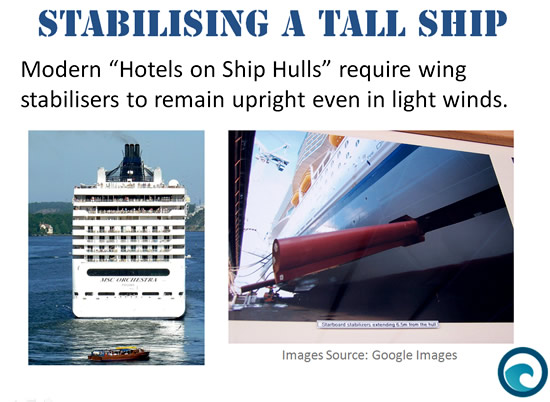
However, there are some concerns about cruise liners becoming too tall.
In the past, there was a reasonable and safe ratio between a vessel’s draft (below the waterline) and air draft (above the waterline).
These days cruise liners seem to be getting designed primarily as multi-storey Hotels, and secondly as actual ships.
These cruise ships have lost the traditional proportions between what’s below and above the waterline, making the vessels dependent on stabilizers not only to battle through rough weather, but also to stay upright with only slight to moderate breezes.
“Stablisers” are discussed in the next section.
The following link is to an article about ships getting too top heavy and too tall.
Click here for Cruise Liners Article
The following 46 minute documentarty viceo is about the world’s largest cruise shipe “The Oasis of the Seas”.
Ship Stabilisers

Image Source: http://sonnyv.smugmug.com
The purpose of stabilizers is to reduce the roll (i.e., the sideways motion) of a ship.
Today, all modern cruise ships have stabilizers. Most ships have two stabilizers, one on each side of the ship. Larger ships like Cunard Line’s Queen Mary 2 and Royal Caribbean’s Voyager, Freedom and Oasis class ships, have four stabilizers, two on each side.
The stabilizers are shaped like airplane wings and extend out from the side of the hull in a perpendicular fashion when in use. They can pivot up and down like the ailerons on an airplane’s wings. Consequently, as the water flows over a stabilizer it can be turned upwards or downwards to exert dive or lift.
When a sensor detects that a wave is pushing the ship one way, the ship’s systems automatically pivot the stabilizers so as to exert pressure in the opposite direction. Captain William Wright of Royal Caribbean reports: “they eliminate about 85% of the roll of the vessel.”
When the ship is in port or when the seas are calm, the stabilizers can be folded back hydraulically into compartments along the side of the hull. Stabilizers can be deployed independently and so the ship’s officers have the option of deploying the stabilizers on one side of the ship or on both sides to suit the sea condition.
Stabilizers do create some drag and thus can in theory reduce speed and fuel efficiency. However, any such loss has to be balanced against the savings in speed and fuel efficiency resulting from reducing the ship’s motion.
The following diagram shows how the lift works for various stabiliser positions.

Image Source: http://www.uq.edu.au
Sea Sickness

Image Source: http://toohighortullo.wordpress.com
The purpose of cruise ship stabilizers is to reduce the side to side rocking motion of the ship.
They help a ship move more smoothly, which cuts down the chance of seasickness for passengers.
When there is a great deal of movement, it can cause a discrepancy between what a person sees and what her inner ear senses. This is what causes seasickness. The smoother the ride, the less chance for this to happen.
Stabilising Pool Tables

Image Source: http://images.dailydawdle.com
How do pool tables stay level on cruise ships?
Ships, and even some large yachts, have pool tables that are kept level when the ship has a slight roll by specially made gimbals.
These keep the pool table from rolling with the ship or yacht in mild conditions.
This makes the pool table self-levelling.
The pool table rests on gimbals and not just table feet on a floor or deck.
Gimbals are also often used on the stoves and cooking tops on ships and yachts.
A Gimbal consists of three concentric rings – the following picture shows what a basic pool table gimbal looks like:

Image Source: http://productions.andrewgentle.com
The following web page has a video of a pool table that uses gyroscopes and computers to create perfectly accurate self levelling.
Click the Link below to watch a Video of a Self-Levelling Pool Table.
Click Here for Pool Table Video
Swimming Pools on Ships

Image Source: http://i47.photobucket.com
What about swimming pools on ships ?
How do they endure stormy weather where the ship rolls side to side ?
Quite simple really – They have a Pool inside a Pool as shown in the following YouTube clip
However for passenger safety, they usually close the pool during storms on ships.
Geometry of Ship Hulls

Image Source: http://www.shipcruise.org
(Click to Enlarge the above Image on a new Screen)
A ship’s hull is the body of the ship, which sits below the main deck.
Through years of trial and error engineers have found that making the hull rounded, wide and deep, helps disperse the weight of the ship across the body of the ship.
Large cruise ship hulls are shaped like a squarish shaped letter “U”
This design allows water to flow away from the vessel, dissipates drag, and facilitates a smooth ride.
Hulls Inside Hulls
In addition to providing passengers with a fluid ride, the hull helps protect a cruise ship so that it doesn’t sink.
Icebergs, reefs, sandbars, and other large, sharp objects can rip apart a ship’s outer layers.
To prevent a major catastrophe shipbuilders typically use extra-strength steel and insert double hulls, or a hull inside a hull,
as an extra precaution.
Mega cruise ships also stay afloat thanks to bulkheads.
These vertical watertight dividers are installed throughout the interior of the hull and help keep damaged ships afloat by containing incoming water into compartments.
By containing the gushing water, the ship should not flood and sink.
Bulbous Bow
Most large ships have a bulb like protrusion under the water line which pushes out a bow wave to partially cancel the waves hitting the bow and provide “cutting through” ability.

However, recent design changes to save fuel consumption costs on large oil tankers has actually changed the traditional ship hull shape, and totally removed the Bulbous Bow.
The following video explains that the designers tried out over 40,000 different hull designs to come up with the final new design.
Prior to the use of computer modelling, it would have been impossible to manuallu do the necessary calculations for 40,000 different designs without it taking years and years of work!
Ballast Water

Image Source: http://www.netpeckers.co.in
Mathematically, there is no real limit to how big a ship can be, as long as it fits through the waterways it sails, or the harbors it enters.
The “Carnival Destiny”, for example, is too large to fit through the Panama Canal.
Of course, the larger a ship gets, the more passengers and cargo it can carry.
This additional weight does not put the ship in danger of sinking.
The extra weight pushes the ship deeper into the water, which displaces more water and increases the buoyant force.
Balast tanks are filled in order to add weight to the ship once cargo has been discharged, and improve its stability.
When a ship is sailing with only Ballast Water, and no cargo or passengers, it is called a “Light Ship”; as in it is light in terms of weight.
In some extreme conditions, ballast water may be introduced to dedicated cargo spaces in order to add extra weight during heavy weather or to pass under low bridges.
Effect of Ballast Water

Image Source: http://www.plantoholiday.com
Most of the time, extra weight actually helps a ship remain stable.
The weight gives the ship a lower center of gravity – the point around which the weight of an object is concentrated.
This means the pull of gravity is greater near the base than the top, so the ship is less likely to topple over.
To stabilize a ship, shipbuilders place the vessel’s heaviest machinery and equipment, like the engines and fuel, at the lowest level, below the waterline.
As the ship’s load lightens, from using up fuel, for example, the ship takes in ocean water for ballast, or added stability.
But the water needs to be in the right place on the ship.
Too much water in the wrong place can make a ship sink.
Water entering a ship’s lowest level can be disastrous; especially if the water fills up only one end of the ship. That’s what happened in the sinking of the Titanic in 1912.
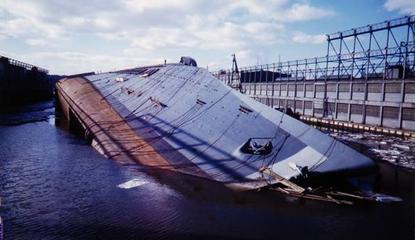
Image Source: http://upload.wikimedia.org
The Normandie, was an ocean liner built in the early 1900s.
While the ship was docked in New York Harbor in 1942, a fire broke out and Firefighters sprayed so much water on the ship’s top deck that the ship became top-heavy.
The Normandie rolled over and sank, right at the dock.
The Safe Loading Level

Image Source: http://ebrd-stories.com
Ships have a red bottom painted onto them, and when a ship is sailing without cargo, the water level will be at the top of this red line boundary along the length of the ship.
A ship can be sailing out of the water partially exposing the red bottom without any risk of sinking, but might be less stable with more side to side roll occuring in big seas.
It is important to realise that not all water weighs the same, and this effects buoyancy.
Freshwater is less dense than sea water, and so a ship will sink down lower in the water, when it sails into a freshwater port.
So when loading in a fresh water port, especially in the tropics (warm water is less dense than cold water), the ship will be lower in the water, (but will not sink).
Then when it sails out into tropical sea water it will rise up higher out of the water, because sea water is more dense (heavier than fresh).
Ships also rise up out of the water as they consume fuel, and their fuel weight consequently decreases.
The safe loadng level in a Port involves making use of markings on the ship’s hull which are called “The Plimsoll Line”.
The Plimsoll Line

Image Source: http://www.marineinsight.com
The Plimsoll Line was originally a long horizontal line painted on the side of merchant ships.
When a ship was loaded, the water level was not supposed to go above the line.
However, the water could reach different parts of the line as its temperature and saltiness varied with season and location.
The basic symbol, of a circle with a horizontal line passing through its centre, is now recognised worldwide.
The Oxford Companion to Ships and the Sea defines the Plimsoll Line as:
A mark painted on the sides of British merchant ships which indicates the draught levels to which a ship may be loaded with cargo for varying conditions of season and location. The Plimsoll Mark shows six loading levels, those which may be used in tropical fresh water; fresh water; tropical sea water; summer, sea water; winter, sea water; and winter, North Atlantic, for vessels under 100 metres (330 ft) in length.

The maximum load capacity of a ship is determined by loading the ship up so that the Plimsoll Line styas just above the water.
Sinking is the most dramatic form of overloading. Before the ship sinks, it will sit so low in the water that even the smallest wave will wash over its deck, flooding the ship and possibly causing it to sink. To avoid this, ships are loaded so that their decks are well above any wave the ship is likely to encounter.
This safe height is identified by the Plimsoll line. The Plimsoll line usually is marked by a color change on the hull that differentiates the portion that is meant to be underwater from the portion that is meant to remain above the water. An empty ship floats high in the water. As cargo is loaded, the ship sits lower. Eventually only the portion that is supposed to remain above the water can be seen. Most prudent owners will not load cargo beyond this maximum.
The original “Plimsoll Mark” was a circle with a horizontal line through it to show the maximum draft of a ship. Additional marks have been added over the years, allowing for different water densities and expected sea conditions.
Letters may also appear to the sides of the mark indicating the classification society that has surveyed the vessel’s load line. The initials used include AB for the American Bureau of Shipping, LR for Lloyd’s Register, GL for Germanischer Lloyd, BV for Bureau Veritas, IR for the Indian Register of Shipping, RI for the Registro Italiano Navale, NK for Nippon Kaiji Kyokai, and NV for Det Norske Veritas. These letters should be approximately 115 millimetres in height and 75 millimetres in width.[7] The Load Line Length is referred to during and following load line calculations.
The letters on the load line marks have the following meanings:
TF – Tropical Fresh Water
F – Fresh Water
T – Tropical Seawater
S – Summer Temperate Seawater
W – Winter Temperate Seawater
WNA – Winter North Atlantic
The following five minute YouTube video which explains the Plimsoll line markings including summer winter tropical etc.
It also covers the the 1/48th of Draft Rule for Winter and Summer Markings.
Fresh water is considered to have a density of 1000 kg/m³ and sea water 1025 kg/m³.
Fresh water marks make allowance for the fact that the ship will float deeper in fresh water than salt water. A ship loaded to her Fresh Water mark in fresh water will float at her Summer Mark once she has passed into sea water. Similarly if loaded to her Tropical Fresh water mark she will float at her Tropical Mark once she passes into sea water.
The Summer load line is the primary load line and it is from this mark that all other marks are derived. The position of the summer load line is calculated from the Load Line Rules and depends on many factors such as length of ship, type of ship, type and number of superstructures, amount of sheer, bow height and so on. The horizontal line through the circle of the Plimsoll mark is at the same level as the summer load line.
The Winter load line is one forty-eighth of the summer load draft below the summer load line.
The Tropical load line is one forty-eighth of the summer load draft above the summer load line.
The Winter North Atlantic load line is used by vessels not exceeding 100 metres in length when in certain areas of the North Atlantic Ocean during the winter period. When assigned it is 50 millimetres below the winter mark.[8]
The calculation of the Fresh Water load line is quite complicated.
The Fresh Water load line is an amount equal to \tfrac{\triangle}{4T} centimetres above the summer load line where \triangle is the displacement in metric tonnes at the summer load draft and T is the metric tonnes per centimetre immersion at that draft.
In any case where \triangle cannot be ascertained the fresh water load line is at the same level as the tropical load line.
The position of the Tropical Fresh load line relative to the tropical load line is found in the same way as the fresh water load line is to the summer load line.
Information Source: http://en.wikipedia.org/wiki/Waterline
That’s it for our look at some of the Geometry and Mathematics associated with ships.
If you want to look further into some of the Hydrodynamics and Mathematics of ships at sea, then here are some weblinks:
Centre of Buoancy and Centre of Gravity
Ship Hull Measurements Diagram
MAV Conference PowerPoint
To download the PowerPoint Presentation from the Mathematics Association of Victoria Conference, click the link below and save the file to your computer.
Mathematics of Ships at Sea
Click the link below to download this 4MB PPT File:
http://passyworldofmathematics.com/MAVconfPPTs/ShipsMathPPTv1.pptx
AMC Teacher Resources
The Australian Maritime College has an excellent set of free resources for Mathematics Teachers.
Among these are some very good mathematical exercises related to Ships.
The AMC is planning to add more online interactive lessons, but as of late 2013 the current the interactive lessons are as follows:
A Study of Similar Vessels (an application of Curve Fitting) – 5mins
Wind Farm Feasibility Study (an application of Probability) – 12mins
Vessel Speeds in Waves (an application of Differentiation) – 5mins
Ship Hydrostatics (an application of Integration) – 12mins
Wave Refraction (an application of Trigonometry) – 12mins
Ocean Waves (an application of Superposition) – 5mins
Scaling Laws (an application of Algebra) – 8mins
Go to the following link to find their Resources page:
http://www.amc.edu.au/why-study-maths
To get the workbooks and other resources, it is necessary to register your school and complete an order form online.
These resources are free to Australian schools, and if you would like to see what some of the workbook exercises look like, then check out the following link:
Click here for AMC Online Maths Workbook PDF
The AMC can be contacted about this program at the following email address: whystudymaths@amc.edu.au
Related Items
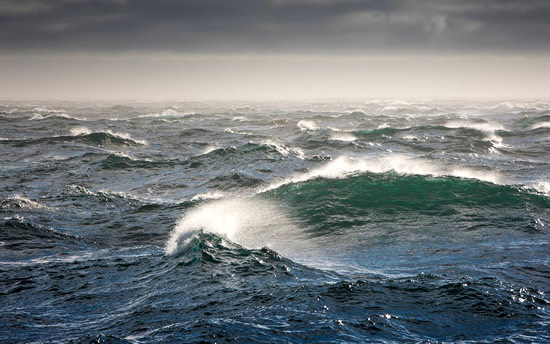
Ocean Mathematics – Overview
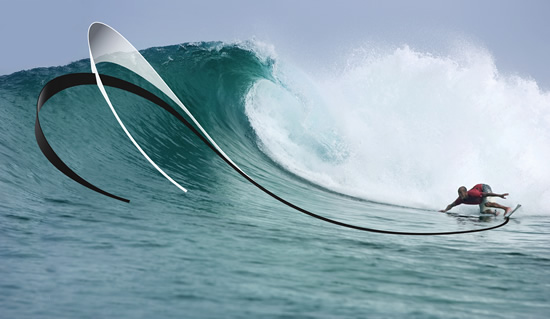
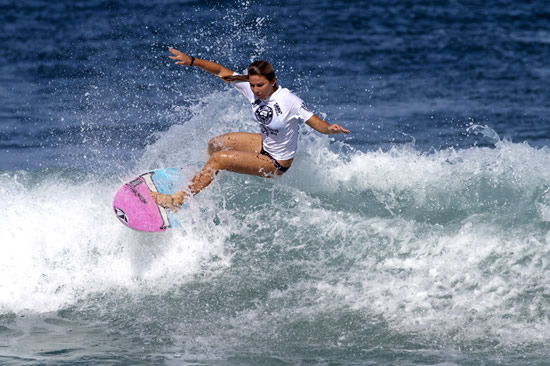
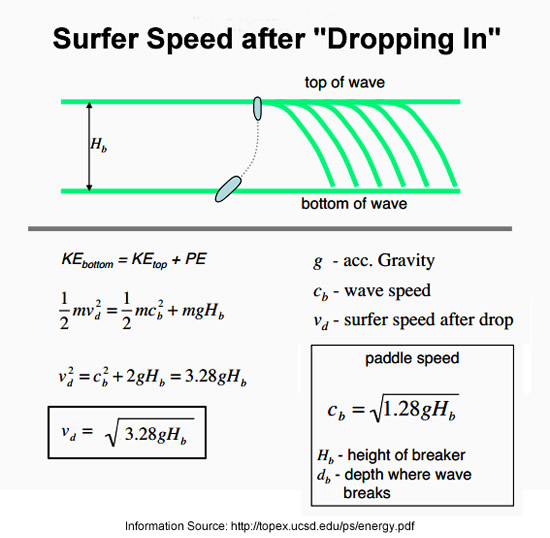
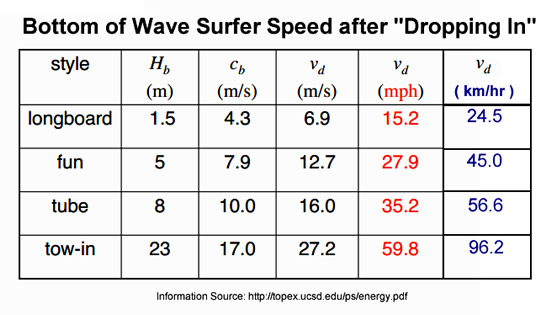
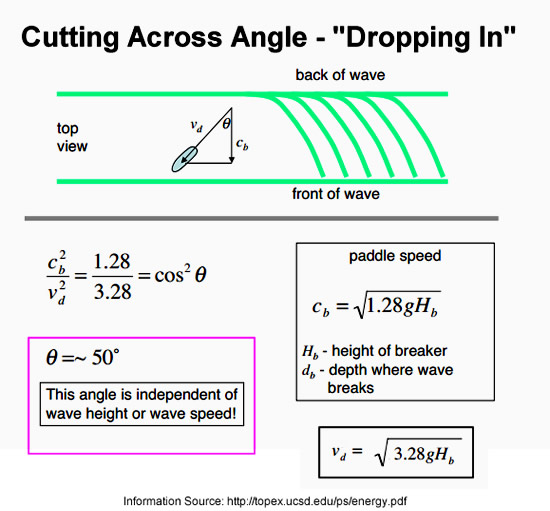
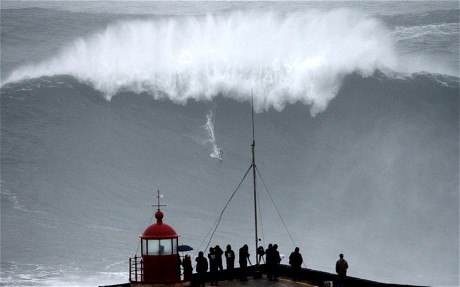
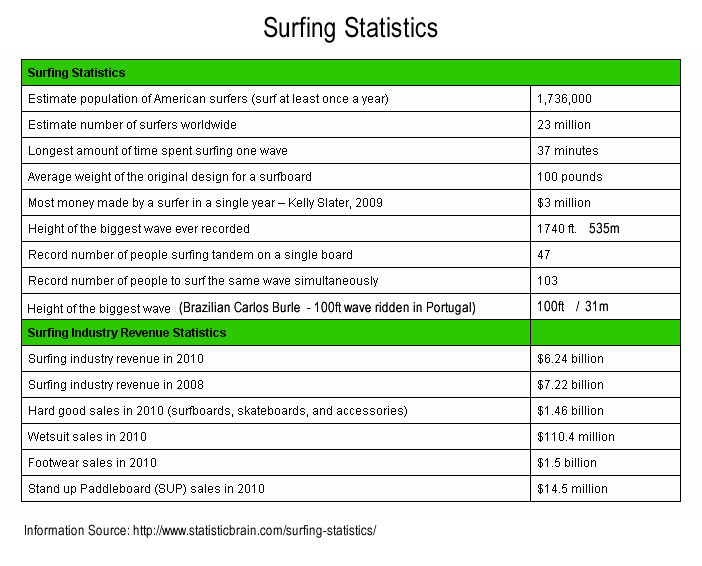
Mathematics of Ocean Waves and Surfing
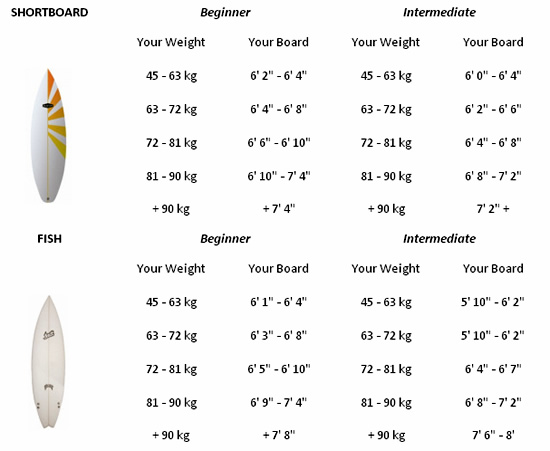
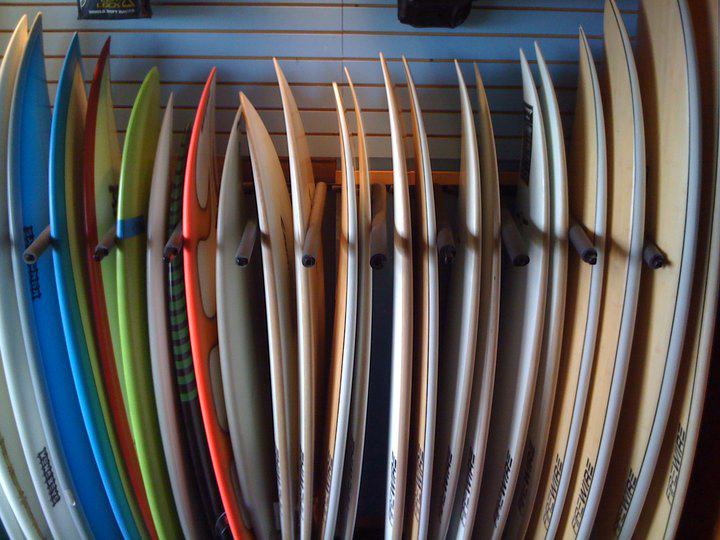
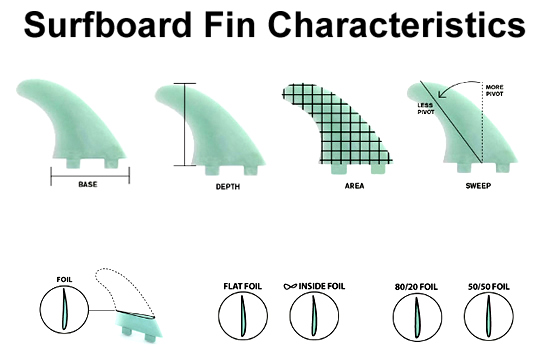
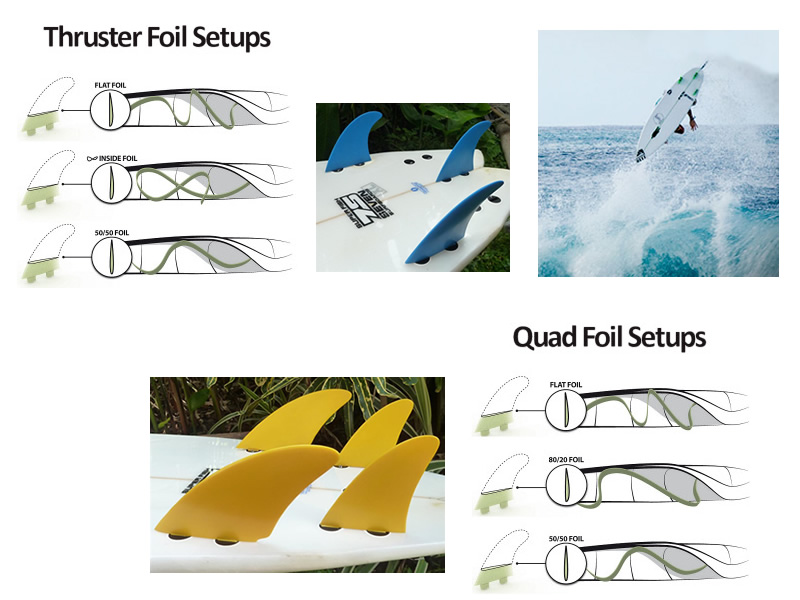
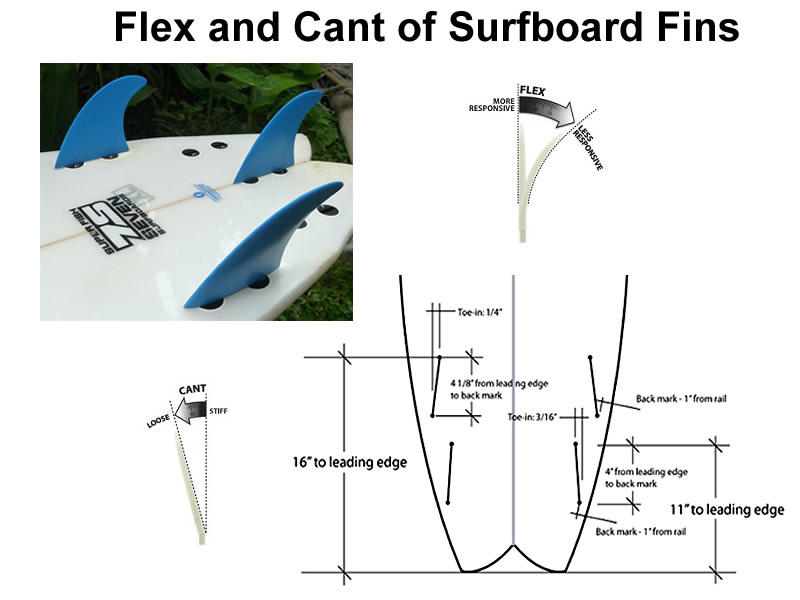
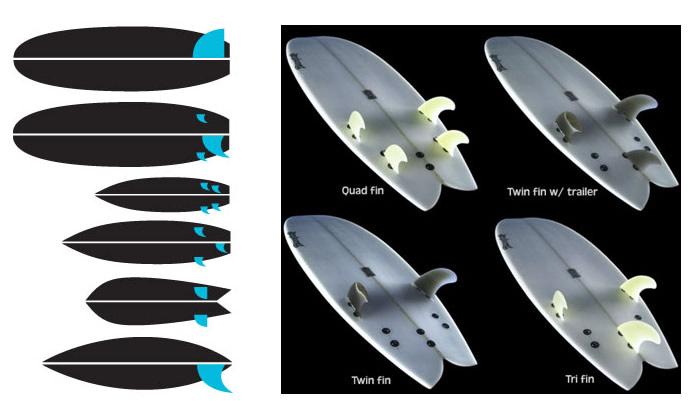
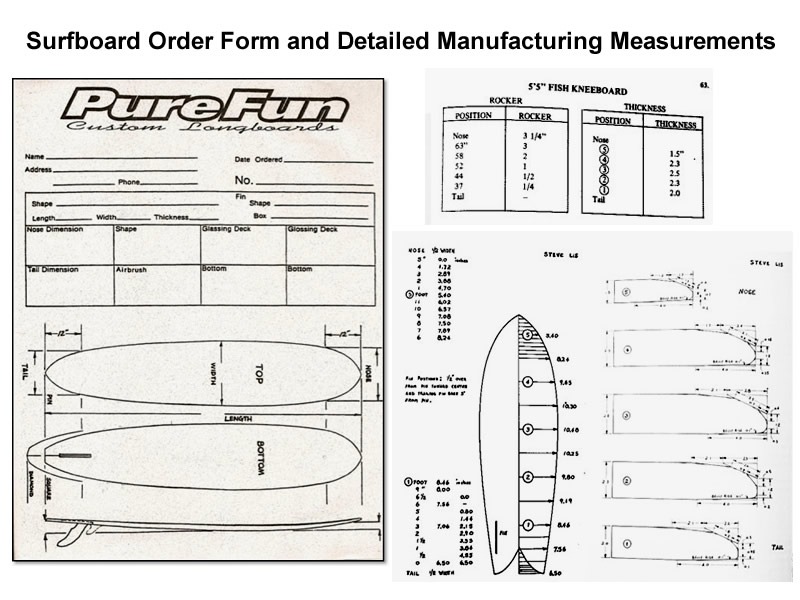
Surfboard Geometry and Design
Tsunami Mathematics
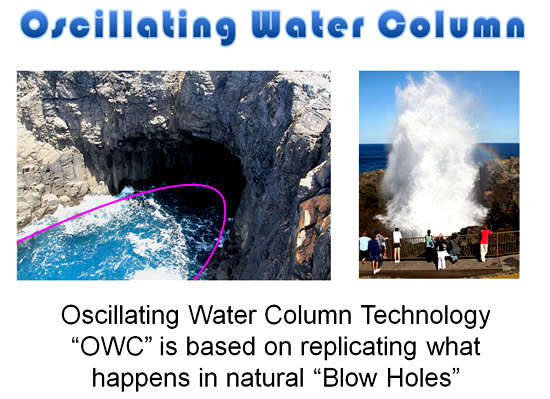
Wave Power Mathematics
Shark Mathematics
Subscribe
If you enjoyed this lesson, why not get a free subscription to our website.
You can then receive notifications of new pages directly to your email address.
Go to the subscribe area on the right hand sidebar, fill in your email address and then click the “Subscribe” button.
To find out exactly how free subscription works, click the following link:
If you would like to submit an idea for an article, or be a guest writer on our website, then please email us at the hotmail address shown in the right hand side bar of this page.
Feel free to link to any of our Lessons, share them on social networking sites, or use them on Learning Management Systems in Schools.
Like Us on Facebook
Our Facebook page has many additional items which are not posted to this website.
These include items of mathematical interest, funny math pictures and cartoons, as well as occassional glimpses into the personal life of “Passy”.
Check it out at the following link:
https://www.facebook.com/PassysWorldOfMathematics
While you are there, LIKE the page so you can receive our FB updates to your Facebook News Feed.
Help Passy’s World Grow
Each day Passy’s World provides hundreds of people with mathematics lessons free of charge.
Help us to maintain this free service and keep it growing.
Donate any amount from $2 upwards through PayPal by clicking the PayPal image below. Thank you!
PayPal does accept Credit Cards, but you will have to supply an email address and password so that PayPal can create a PayPal account for you to process the transaction through. There will be no processing fee charged to you by this action, as PayPal deducts a fee from your donation before it reaches Passy’s World.
Enjoy,
Passy