
Image Copyright 2013 by Passy’s World of Mathematics
This statistics lesson is all about Symmetry Skew and the Kangaroo !
The shape of a Histogram, Bar Chart, or Stem and Leaf plot tells us the type of data distribution we have.
If the tallest area (Mode) is in the middle of the Graph, with even reducing on each side of this, the Graph is called Symmetrical.
If the shape of the graph is not like this, and is bunched up on either the left or right side, we say the data is “Skewed”.
Skewed Data results for situations where there are either a lot of measured items that are very small, or a lot of items that are very large.
Skewed Graphs with their uneven shape affect the Mean Average Value.
This often means that we should use the Median as our average in these situations, and not use the distorted Mean value.
Positive Skew
The following example demonstrates and shows “Positive Skew”, where a Histogram stretches out to the right.
This particular class of students has not performed well on the Algebra Test, and so we have many low scores with tall bars on the left.
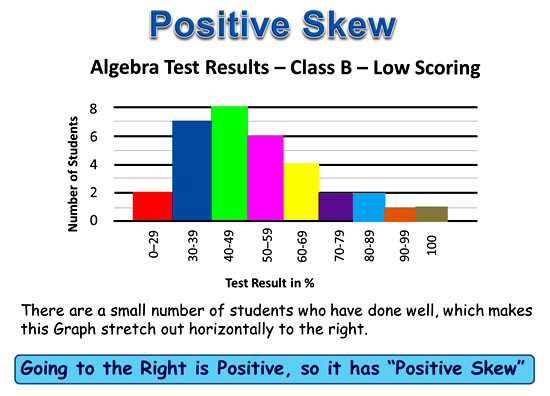
Image Copyright 2013 by Passy’s World of Mathematics
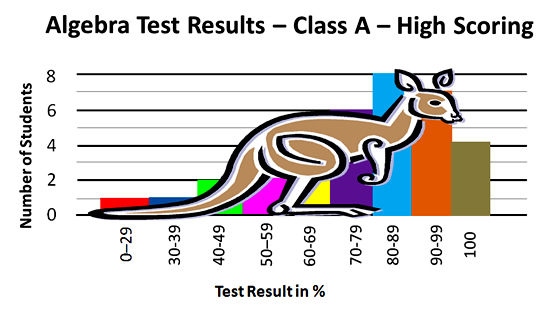
We can think of the shape of the Graph as resembling an Australian Kangaroo, and the direction of the Roo’s tail tells us the direction of the skew.
We call this the “Skew and Kangaroo Rule”.

Image Copyright 2013 by Passy’s World of Mathematics
Having an uneven skew shape in the Graph also affects the Mean,Median, and Mode.
The Mode is to the left of the middle Median, because the tall bars are all on the left hand side of the graph.
Due to the long tail of high values stretching to the right, the Mean will be dragged to the right of the Median.
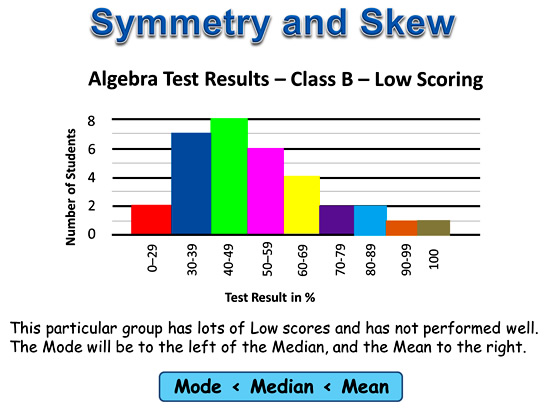
Image Copyright 2013 by Passy’s World of Mathematics
Negative Skew
The following example demonstrates and shows “Negative Skew”, where a Histogram stretches out to the left.
This particular class of students has performed very well on the Algebra Test, and we have many high scores with tall bars on the right.
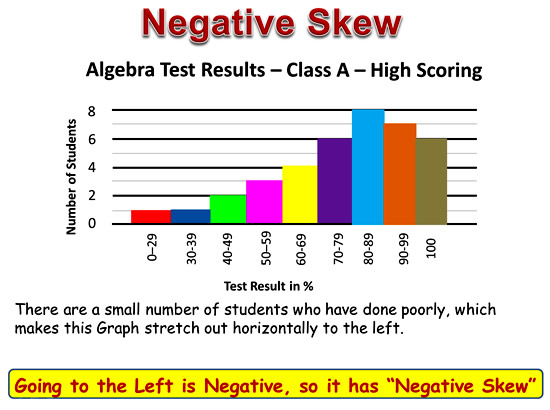
Image Copyright 2013 by Passy’s World of Mathematics
Placing a Kangaroo onto the graph shows that the tail goes to the left.
This means that the skew is to the Left, which is the negative direction.
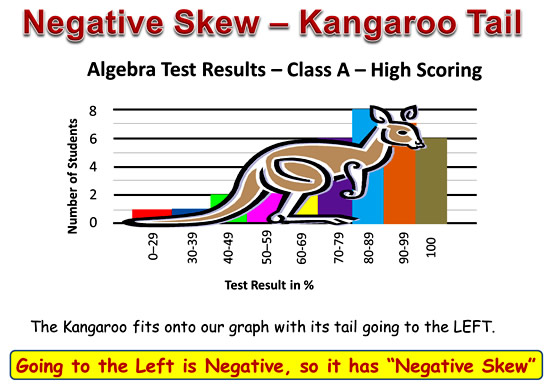
Image Copyright 2013 by Passy’s World of Mathematics
Having an uneven skew shape in the Graph also affects the Mean,Median, and Mode.
The Mode is to the right of the middle Median, because the tall bars are all on the right hand side of the graph.
Due to the long tail of low scores stretching to the left, the Mean will be dragged to the left of the Median.

Image Copyright 2013 by Passy’s World of Mathematics
Symmetrical Histogram
If our Histogram is a pyramid type balanced shape, with both sides of the Median pretty much the same shape, then we say it is “Symmetrical”.
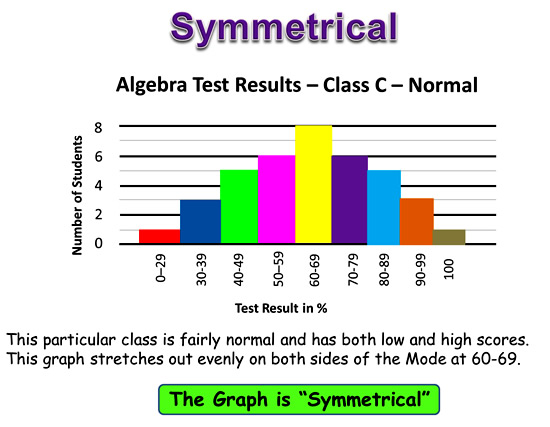
Image Copyright 2013 by Passy’s World of Mathematics
The “Kangaroo Rule” fits onto a symmetrical graph as shown below.

Image Copyright 2013 by Passy’s World of Mathematics
This particular maths class is fairly normal, and the sudents have produced both low and high scores.
The Mean, Median, and Mode will all be close together in the middle.
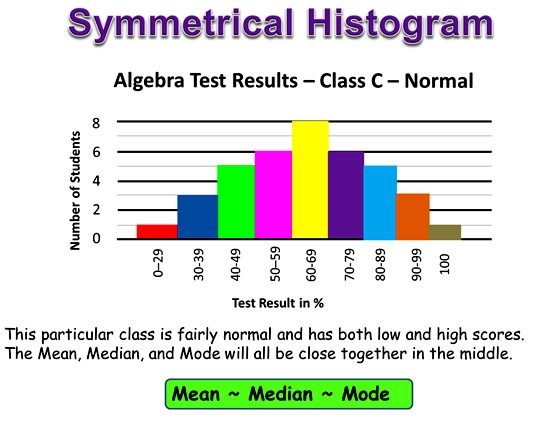
Image Copyright 2013 by Passy’s World of Mathematics
Skewed Histograms Video
The following video uses Microsoft Excel to show examples of Skewed Histograms, and how their shape affects the Mean Average Value.
Stem and Leaf Plot Symmetry and Skew
Measurement of Skew can also be applied to Stem and Leaf Plots.
However, we need to view the S&L Plot sideways to see whether the Skew is to the left or the right.
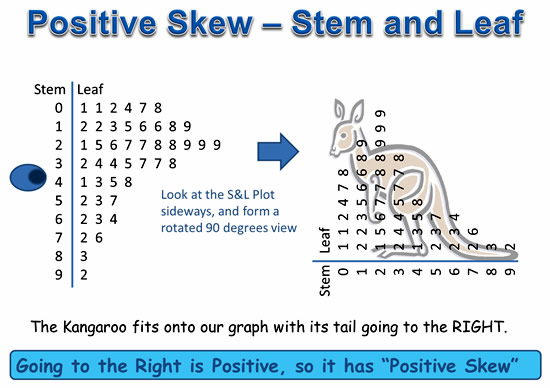
Image Copyright 2013 by Passy’s World of Mathematics
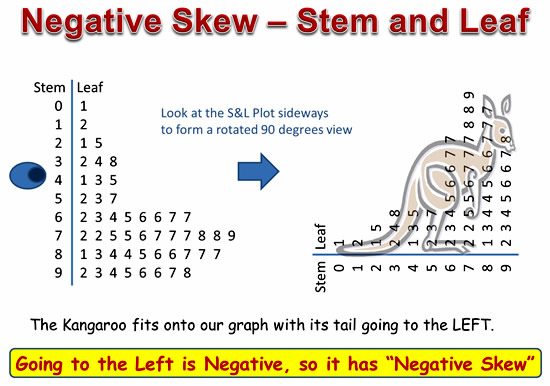
Image Copyright 2013 by Passy’s World of Mathematics
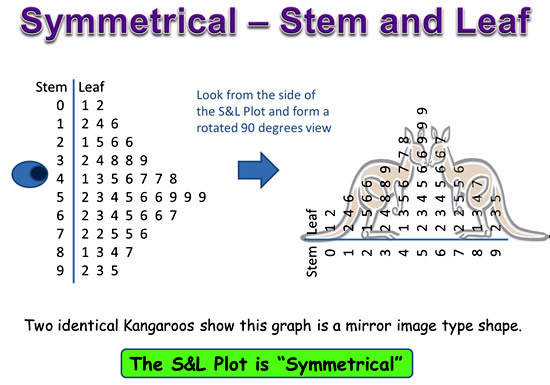
Image Copyright 2013 by Passy’s World of Mathematics
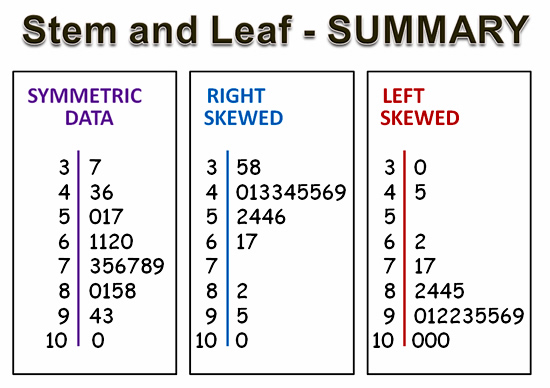
Image Copyright 2013 by Passy’s World of Mathematics
Summary
The shape of a Histogram, Bar Chart, or Stem and Leaf plot tells us the type of data distribution we have.
There is a great one page summary about Skew on the following web page:
http://www.mathsisfun.com/data/skewness.html
If the tallest area (Mode) is in the middle of the Graph, with even reducing on each side of this, the Graph is called Symmetrical.
If the shape of the graph is not like this, and is bunched up on wither the left or right side, we say the data is “Skewed”.
Skewed Data results for situations where there are either a lot of measured items that are very small, or a lot of items that are very large.
Skewed Graphs with their uneven shape affect the Mean Average Value.
This often means that we should use the Median as our average in these situations, and not use the distorted Mean value.
Kangaroo Statistics

Image Source: http://www.wildlifepark.com.au
The Australian Red Kangaroo is the world’s largest marsupial.
Females have one baby at a time, which at birth is smaller than a cherry.
Males are up to 1.8m (6 ft) tall and weigh up to 84 kg (187lbs).
Kangaroos continue to grow during all their life, which can be up to 20 years.
Giant short faced kangaroos (Procoptodon), extinct 40,000 years ago, were 3 m (10 feet tall) and weighed 200 kg.
Kangaroos live in groups made of 8 to 25 individuals, called mobs. A mob is made up of a male (the leader), several females and the young.
The stomach represents 15 % of the kangaroo’s weight.
Kangaroos can exist without water for up to 2 to 3 months.
Kangaroo’s back feet are made of two joined toes. The toe is extremely long bearing a large nail that makes a kangaroo’s kick extremely dangerous for dogs and even humans.
The tail is up to 1.1 m or 3.6 ft long in large kangaroos, and is used for leaning and for balancing during jumps.
Normal jumps are 1.2-1.9 m (4-6 ft) long, but at high speed they can be 13.5 m (45 ft) long and 3.3 m (11 ft) high.
The kangaroo can speed up to 50 km (30 mi) per hour, but it cannot sustain this speed for long periods.
Kangaroo Meat is one of the highest red meat protein sources and is very lean and healthy to eat.
There are set numbers for how many Kangaroos can be “harvested” yearly so that the natural population of Roos stays in environmental balance and is preserved.
“Harvested” means killed commercially for the meat and fur markets.
There are lots of statistics on Kangaroo Populations at the following Government Website:
Click here for Kangaroo Statistics
For those worried about harvesting making Kangaroos in danger of extinction, statistics show that in 2010 there were around 25 million Kangaroos in Australia. Eg. More Kangaroos than People!
Related Items
Stem and Leaf Plots
Back to Back Stem and leaf Plots
Mean Median Mode of Ungrouped Data
Mean Median Mode and MS Excel
Grouped Data Histogram Graphs
Basic Histogram Graphs
MS Excel Charts and Graphs
MS Excel Column Graphs and Pie Charts
Funny Graphs from Graph Jam
Misleading Graphs
Real Life Graphs
Free Online Graph Makers
Subscribe
If you enjoyed this lesson, why not get a free subscription to our website.
You can then receive notifications of new pages directly to your email address.
Go to the subscribe area on the right hand sidebar, fill in your email address and then click the “Subscribe” button.
To find out exactly how free subscription works, click the following link:
If you would like to submit an idea for an article, or be a guest writer on our website, then please email us at the hotmail address shown in the right hand side bar of this page.

If you are a subscriber to Passy’s World of Mathematics, and would like to receive a free PowerPoint version of this lesson, that is 100% free to you as a Subscriber, then email us at the following address:

Please state in your email that you wish to obtain the free subscriber copy of the “Symmetry and Skew” Powerpoint.
Feel free to link to any of our Lessons, share them on social networking sites, or use them on Learning Management Systems in Schools.
Like Us on Facebook
Our Facebook page has many additional items which are not posted to this website.
These include items of mathematical interest, funny math pictures and cartoons, as well as occassional glimpses into the personal life of “Passy”.
Check it out at the following link:
https://www.facebook.com/PassysWorldOfMathematics
While you are there, LIKE the page so you can receive our FB updates to your Facebook News Feed.
Help Passy’s World Grow
Each day Passy’s World provides hundreds of people with mathematics lessons free of charge.
Help us to maintain this free service and keep it growing.
Donate any amount from $2 upwards through PayPal by clicking the PayPal image below. Thank you!
PayPal does accept Credit Cards, but you will have to supply an email address and password so that PayPal can create a PayPal account for you to process the transaction through. There will be no processing fee charged to you by this action, as PayPal deducts a fee from your donation before it reaches Passy’s World.
Enjoy,
Passy


